Intermediate📖 17 min read🏷 Market Mechanics
POWER OF THREE (AMD)
SHARE FREE:
Using AMD to Study Possible Intraday Price Sequences
ICT Flow EditorialIndependent educational resource
This lesson explains concepts commonly taught in ICT/SMC trading education and presents them as frameworks to study and test. Chart patterns cannot independently prove institutional intent, future price delivery, or profitability. Examples and rules are educational, not trading advice.
Read our editorial standards →The Power of Three (PO3), also known as AMD (Accumulate, Manipulate, Distribute), is an ICT framework for interpreting a possible sequence in price delivery; it should not be treated as a description of every trading day. The three-phase model can help organize a daily narrative, but it will not explain every market session. Losing trades can have many causes, including execution, risk management, market conditions and flaws in a tested rule set.
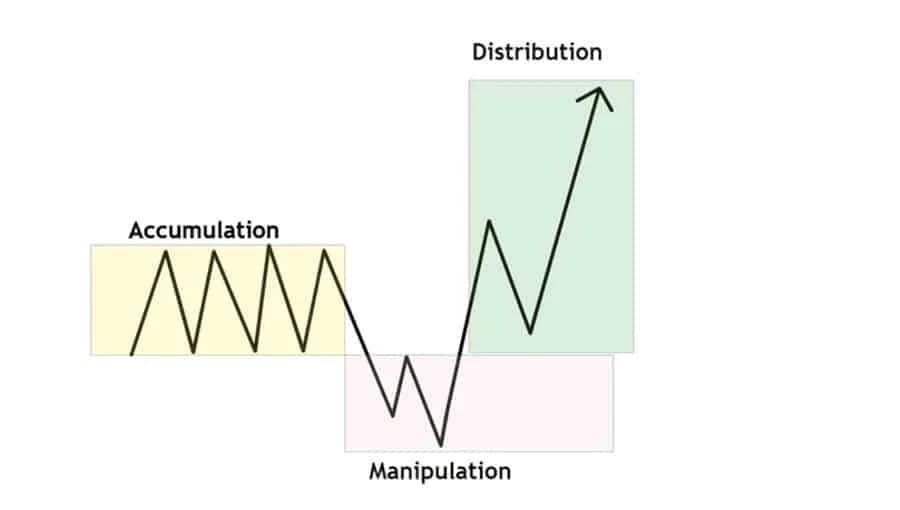
AMD: an ICT framework for interpreting a possible Asia-London-New York sequence
// Lesson Content
The AMD framework describes a three-phase structure that traders may use to organize a session narrative:
ACT 1 — ACCUMULATION (Asian Session, 8 PM – 12 AM EST):
ICT teaching often labels this phase "Accumulation" and studies the Asian range as context for later session analysis. Actual participant positioning cannot be confirmed from the chart, and the session can behave differently across markets and days. Mark the range because its high and low may be useful reference levels.
ACT 2 — MANIPULATION (London Session, 2 AM – 5 AM EST):
In this framework, the manipulation phase can involve a move opposite the eventual directional move; the sequence and direction are not guaranteed. Some ICT explanations describe a bullish example as London first moving below the Asian range and a bearish example as London first moving above it. Treat these as hypotheses to test rather than assuming a fixed sequence, retail positioning, or institutional intent.
ACT 3 — DISTRIBUTION (New York AM, 7 AM – 12 PM EST):
ICT teaching often frames this window as "Distribution" after the earlier session phases. Price can expand during New York AM, but the direction, range contribution and usefulness of the pattern vary by market and day. Treat the three-act sequence as a testable framework rather than assuming the first two phases determine the outcome.
📌 Treat the London open and any initial move as context. A Judas-style move can occur, but the first move is not reliably the wrong direction every day.
Within ICT teaching, a “Judas Swing” is a label for a possible move against a subsequent directional scenario. The label does not establish that traders were deliberately deceived or reveal who placed orders.
How it works on a bullish day:
• Example: a session range is marked between 1.0800 and 1.0850.
• Price trades below the lower reference; record whether it meets the predefined sweep rule.
• The chart alone does not show how retail traders positioned.
• Other traders' stop placement cannot be inferred from this chart pattern alone.
• Under this model, the move may be classified as a sell-side reference interaction; actual order flow is not verified.
• In ICT-style explanations, traders may interpret sell-side liquidity as an area where buy orders could be filled; actual institutional transactions cannot be observed directly.
• Price may reverse, continue downward or remain in a range; record each outcome.
• Subsequent stop-outs and their effect on price cannot be confirmed from the chart alone.
• A bullish close describes the final candle but does not prove the preceding phase labels.
The Judas-style sequence can recur across sessions, but its consistency varies. A lower-timeframe ChoCH can be one confirmation method within this framework, not proof that the pattern has completed.
📌 A Judas-style move is a possible ICT interpretation, not a rule that London’s first move is usually wrong. Define the confirmation and invalidation conditions before testing it.
One of the most profound insights ICT offers is that you can read the STRUCTURE of a single daily candle as an AMD story:
A Bullish Daily Candle:
• Open (midnight open)
• A lower wick may be interpreted as a possible move against the close direction; this does not verify manipulation
• A long green body describes net upward movement; it does not establish a distribution phase
• Small wick UP = sometimes a minor London Close reversal
• Close near the high
A Bearish Daily Candle:
• Open
• An upper wick may be interpreted as a possible move against the close direction; this does not verify manipulation
• A long red body describes net downward movement; it does not establish a distribution phase
• Close near the low
A daily candle with a long lower wick and bullish body can be interpreted through the AMD framework as possible accumulation/manipulation/distribution, but a single candle cannot confirm those underlying events.
📌 Wick/body combinations can be used as descriptive context within AMD analysis; they do not by themselves establish a “perfect” AMD day.
ICT describes PO3/AMD as a fractal framework that can be applied across timeframes; whether the sequence transfers consistently across timeframes is an empirical question.
Weekly AMD:
• Monday: some narratives treat early-week price as range formation; test this definition
• Tuesday/Wednesday: a move against a later direction is one possible hypothesis, not a fixed phase
• Thursday/Friday: later-week expansion may occur, but weekday alone does not establish direction
Monthly AMD:
• Some narratives treat the first week as range formation.
• A later move against that range is sometimes labelled manipulation.
• Later-week expansion is sometimes labelled distribution.
These weekday labels are hypotheses to test, not fixed phases of every month.
Weekly AMD is one narrative that traders can define and test. A sweep on a Tuesday does not determine the eventual weekly close; record both successful and failed scenarios and compare with a baseline.
Some ICT materials describe Tuesday as a possible day for a weekly Judas Swing, with a potential later-week directional move. Treat this as an attributed hypothesis rather than an established market regularity, and test defined rules across representative data.
📌 Some ICT narratives map weekly phases to specific weekdays. Treat this as a calendar hypothesis to define and test, not a reliable Monday-to-Friday market script.
// Test Your Understanding
// KNOWLEDGE CHECK
1. In some ICT descriptions, what does the "M" (Manipulation) phase refer to?
2. On a bullish AMD day, the lower wick of the daily candle represents...
3. How should the claim that Tuesday is common for a weekly Judas Swing be treated?
// What to study next
Continue your ICT journey