Intermediate📖 22 min read🏷 Price Theory
PREMIUM & DISCOUNT
SHARE FREE:
Premium and Discount: Comparing Price Within a Defined Range
ICT Flow EditorialIndependent educational resource
This lesson explains concepts commonly taught in ICT/SMC trading education and presents them as frameworks to study and test. Chart patterns cannot independently prove institutional intent, future price delivery, or profitability. Examples and rules are educational, not trading advice.
Read our editorial standards →One important concept in ICT is this: ICT presents premium/discount as a framework for judging relative price within a defined range. It can be used as contextual information, but it does not determine every institutional transaction or guarantee better entries. The Premium & Discount framework is ICT's answer to the question every trader asks: "Is this a good price to enter?"
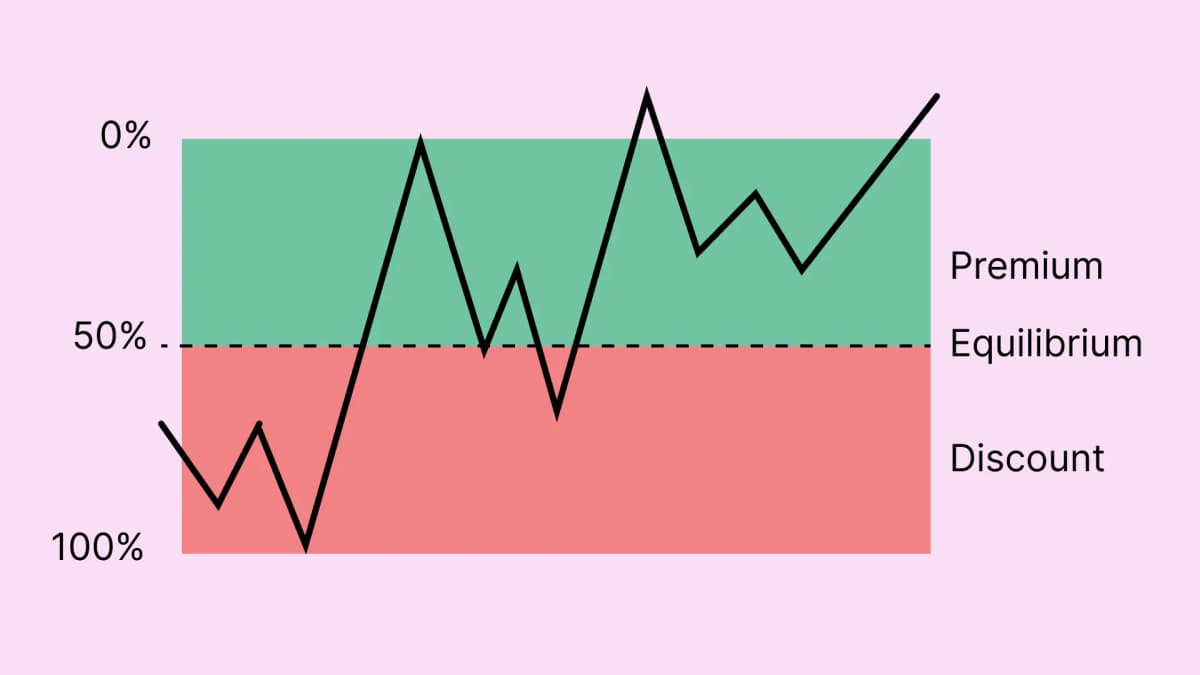
Premium vs Discount: ICT premium/discount framing: traders study selling in premium and buying in discount relative to a swing range
// Lesson Content
Here is the fundamental insight: there is no such thing as an objectively "good" or "bad" price. Price is only good or bad RELATIVE to a range. A price that is cheap in one context is expensive in another.
ICT uses the Fibonacci retracement tool not to predict reversal levels — but to define premium and discount zones within any swing range.
Here's how it works:
• Identify a significant swing low and swing high (or high to low for bearish)
• Draw a Fibonacci from the swing low to the swing high
• The 50% level (equilibrium) divides the range in half
• Everything ABOVE the 50% = Premium Zone (relatively higher within the range)
• Everything BELOW the 50% = Discount Zone (relatively lower within the range)
This is a commonly taught ICT framing of price relative to a dealing range:
• Traders may study discount areas (below 50%) for potential long setups
• Traders may study premium areas (above 50%) for potential short setups
• Actual order flow and future direction cannot be confirmed from premium/discount location alone
This framework is intended to help traders compare price relative to a range; it does not establish that retail traders consistently enter at extremes or that institutions systematically take the opposite side.
📌 Study guideline: Some ICT traders use discount/premium as a directional filter. Treat it as one contextual input and test whether it improves your entries.
In some ICT teachings, the Optimal Trade Entry (OTE) is a retracement zone placed within a defined premium or discount range. One common version uses three Fibonacci levels:
For a BULLISH OTE (buy zone in discount):
• 62% retracement — start of the OTE zone
• 70.5% retracement — the deepest sweet spot
• 79% retracement — the outer limit of the OTE zone
If price retraces into the defined 62–79% zone after a bullish BOS, an ICT trader using this OTE version may consider it a candidate entry area. The retracement does not itself establish a valid entry, institutional buying or a successful reversal; apply the model's other conditions and invalidation rules.
These levels are part of the ICT OTE framework. Claims about institutional re-entry or consistent demand at a specific Fibonacci level are theoretical and should be tested rather than treated as established market mechanics.
For a BEARISH OTE (sell zone in premium):
• 62% retracement of a swing high to low
• 70.5% level
• 79% level
The OTE is not a guarantee; within the ICT framework it is commonly studied as a potential entry zone, and its performance should be tested. It must be combined with a liquidity sweep, a Fair Value Gap or Order Block, and alignment with the higher timeframe narrative.
📌 The OTE zone is 62%-79% of a Fibonacci retracement. Within the ICT framework, this zone is commonly studied as a potential entry area rather than evidence that "smart money" is re-entering. Define your entry and invalidation rules in advance and test them rather than assuming the zone should be traded.
Within the premium and discount framework, ICT identifies specific price delivery arrays — zones that the framework treats as potential reaction areas. From most premium to most discount:
PREMIUM ARRAYS (selling opportunities):
1. Old Highs / Buy-Side Liquidity (BSL) — most premium
2. Bearish Order Blocks
3. Bearish Fair Value Gaps (FVGs)
4. Equilibrium (50%) — the dividing line
5. Bullish Fair Value Gaps
6. Bullish Order Blocks
7. Old Lows / Sell-Side Liquidity (SSL) — most discount
This spectrum provides a way to organize potential resistance in premium and support in discount; actual reactions vary by instrument, timeframe, and market conditions.
Understanding this spectrum can help organize setups by context. An old SSL combined with bullish OB/FVG confluence may be treated as a higher-confluence example within this framework, but it does not establish the highest-quality outcome or guarantee undervaluation.
📌 The premium/discount spectrum organizes zones by their position in a range. Extremes can be studied as potential reaction areas, but reversal probability varies with market conditions.
The premium/discount framework is fractal — it applies at every timeframe simultaneously. This is where ICT's multi-timeframe analysis becomes powerful.
The process:
1. Weekly chart: Identify the major swing high and low. Is price in weekly premium or discount?
2. Daily chart: Identify the daily swing. Is price in daily premium or discount?
3. 4H chart: Same analysis
4. 1H/15M: Find your entry within the OTE
Some traders look for greater confluence when multiple timeframes agree:
• Weekly: Discount (bullish bias)
• Daily: Discount (bullish bias)
• 4H: Pullback into discount after BOS
• 1H/15M: OTE entry with FVG or OB
When multiple ranges show discount, the framework may provide additional context for a potential long setup. This does not reveal what institutional traders are doing or guarantee that price is at the cheapest possible level.
The opposite alignment can be studied as premium context for potential short setups; it should not be treated as an exclusive sell condition.
📌 Multi-timeframe discount alignment can provide additional confluence in this framework. It does not guarantee institutional backing or a trading outcome.
Even traders who understand the concept make critical errors in application:
Mistake 1 — Wrong swing selection:
The range you draw determines everything. Using the wrong swing high/low gives you the wrong premium/discount zones. Use a recent, meaningful swing that fits the range and timeframe you are analyzing; compare alternative swing selections when testing the framework.
Mistake 2 — Ignoring the higher timeframe:
A lower-timeframe discount signal can conflict with a higher-timeframe premium context. Higher-timeframe context may carry more weight in this framework, but the appropriate hierarchy should be tested.
Mistake 3 — Entering at equilibrium:
The 50% level is not a buy or sell zone — it's neutral. Many traders try to enter at exactly 50% and get chopped up. The ICT OTE framework commonly uses a 62% starting level; this is a framework convention rather than evidence that 62% is inherently superior.
Mistake 4 — Abandoning the concept during strong trends:
In a very strong uptrend, price sometimes only retraces to the 38.2% or 50% level before continuing. In these cases, the OTE (62-79%) may not be reached. Don't force the framework — if price gives you a clear signal at a shallower retracement with a valid order block, take it.
Mistake 5 — No directional bias:
Within this framework, traders often combine premium/discount with a directional context from market structure. The exact sequence and filter can be tested rather than treated as mandatory.
📌 Swing selection affects a premium/discount analysis. Define what qualifies as the reference swing before reviewing outcomes, and apply that rule consistently during testing.
// Test Your Understanding
// KNOWLEDGE CHECK
1. Within ICT's premium/discount framework, which area is commonly taught as a candidate for bullish setups?
2. What are the three Fibonacci levels that define the OTE zone?
3. If weekly, daily, and 4H price are all in discount under their defined ranges, what does that establish?
// What to study next
Continue your ICT journey