Beginner📖 16 min read🏷 PD Arrays
FAIR VALUE GAPS (FVG)
SHARE FREE:
Imbalances, Potential Repricing Areas, and How to Study Them
ICT Flow EditorialIndependent educational resource
This lesson explains concepts commonly taught in ICT/SMC trading education and presents them as frameworks to study and test. Chart patterns cannot independently prove institutional intent, future price delivery, or profitability. Examples and rules are educational, not trading advice.
Read our editorial standards →Fair Value Gap (FVG) is a core ICT concept and a useful framework to study price imbalance. Traders study FVGs across timeframes and instruments as areas of price imbalance; how price reacts when it revisits an FVG should be evaluated in context.
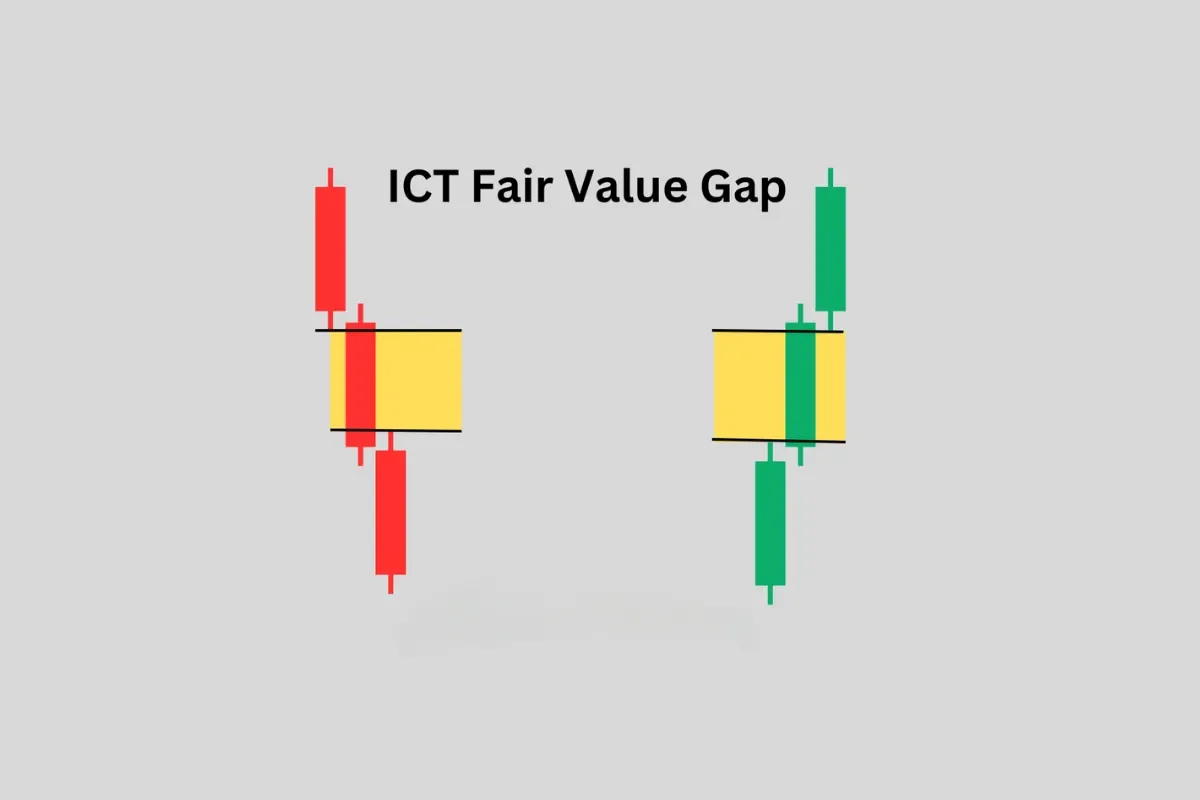
A bullish FVG: gap between candle 1 high and candle 3 low — an area some traders monitor for a possible revisit
// Lesson Content
A Fair Value Gap (FVG) is a three-candle price formation where the middle candle moves so aggressively that it leaves a price gap — a zone where no two-sided trading occurred.
Here's how to identify a Bullish FVG:
• Candle 1: any candle
• Candle 2: a large bullish candle (the "displacement" candle)
• Candle 3: the next candle
• The FVG = the gap between the HIGH of Candle 1 and the LOW of Candle 3
If Candle 3's low is ABOVE Candle 1's high — there is a gap where price skipped. That gap is the FVG. Price passed through it so fast that buyers and sellers couldn't meet there. The market is "imbalanced" in that zone.
Bearish FVG is the mirror: Candle 3's HIGH is below Candle 1's LOW after a large bearish displacement candle.
📌 The FVG is the gap between Candle 1's high and Candle 3's low (bullish). Mark it on your chart — price may revisit this zone; revisit frequency and reaction should be tested.
Price returns to FVGs because of the mechanics of how large institutional orders get filled. When a bank places a massive order, it creates a displacement move — price moves so fast that many orders can't get filled at those levels. The Some ICT teachings describe this as an algorithmic explanation, but it is not a directly verified mechanism.
Think of it this way: imagine you're at an auction and the bidding jumps from $100 to $150 in one instant. Someone missed their chance to bid at $120. A market may revisit prior prices, but the auction analogy does not establish why any specific FVG will be revisited. That's the FVG.
For ICT traders, FVGs can serve as potential areas of interest or confluence. Their usefulness should be evaluated with market context and personal testing rather than assumed to outperform other forms of analysis.
📌 FVGs aren't just patterns — they represent unfilled institutional orders. Some ICT teachings use an algorithmic explanation for FVG behavior, but the mechanism and performance should be treated as a hypothesis to test.
Bullish FVG (Buy from here in a bullish bias):
• Forms during a bullish displacement (large upward candle)
• Located BELOW current price after the move
• Price comes back down into this zone = retracement
• In a bullish bias, this can be a potential buy area when supported by a tested setup
• Entry: wait for price to enter the FVG, look for a reaction candle
Bearish FVG (Sell from here in a bearish bias):
• Forms during a bearish displacement (large downward candle)
• Located ABOVE current price after the move
• Price comes back up into this zone = retracement
• In a bearish bias, this can be a potential sell area when supported by a tested setup
A common filtering rule is to align FVG direction with higher-timeframe bias; test whether this improves your setup quality. Using an FVG against the HTF bias is one of the most common mistakes ICT beginners make.
📌 Some traders use HTF alignment as an FVG filter. Treat it as contextual information to test, not a guarantee that opposing setups are traps.
ICT has introduced several variations of the FVG concept:
Consequent Encroachment (CE): The 50% midpoint of the FVG. Some ICT traders monitor this midpoint when studying FVG revisits. A reaction there can be treated as a testable entry condition rather than a guaranteed reversal.
Inverse FVG (IFVG): When an FVG gets fully filled and price passes through it — the FVG "inverts" its polarity. A bullish FVG that gets completely filled becomes a bearish resistance zone on re-test.
Balanced Price Range (BPR): When a bullish FVG and bearish FVG overlap on different timeframes, creating an exceptionally strong zone that is a higher-confluence zone in this framework; any performance difference should be tested.
1st Presented FVG: In any displacement, the FIRST FVG that forms is the most important. ICT specifically targets the first one because it is closest to where the institutional order was placed.
BISI (Buy-side Imbalance, Sell-side Inefficiency): A bullish FVG — price imbalanced to the buy-side.
SIBI (Sell-side Imbalance, Buy-side Inefficiency): A bearish FVG — price imbalanced to the sell-side.
📌 Most important variations: CE (50% of FVG), IFVG (inverted after full fill), BPR (overlapping FVGs = double strength).
Here is how to trade an FVG from start to finish:
Step 1 — Establish HTF Bias. Check Daily/4H. Is structure bullish or bearish? Only use FVGs that align.
Step 2 — Identify a Liquidity Sweep. Price sweeps SSL (in bullish scenario). This starts the reversal.
Step 3 — Find the FVG. After the sweep, a bullish displacement move forms. Mark the FVG (gap between candle 1 high and candle 3 low).
Step 4 — Wait for Price to Return. Price pulls back into the FVG zone. You're not chasing — you're waiting.
Step 5 — Entry Trigger. Look for a small bullish confirmation candle inside the FVG. Or simply enter at the CE (50%) of the FVG with a limit order.
Step 6 — Stop Loss. Below the low of the FVG (for bullish trades). This invalidates the FVG if hit.
Step 7 — Target. The next liquidity pool above (BSL, previous high, etc.).
Risk/reward outcomes vary by setup and market; use the target and stop rules defined by your tested plan.
📌 A commonly studied ICT sequence is SSL Sweep → Bullish Displacement → FVG → potential entry near CE. Treat it as a testable setup, not a guaranteed outcome.
// Test Your Understanding
// KNOWLEDGE CHECK
1. A Fair Value Gap forms between...
2. CE (Consequent Encroachment) refers to...
3. An Inverse FVG (IFVG) forms when...
// What to study next
Continue your ICT journey