Beginner📖 20 min read🏷 Foundation
LIQUIDITY CONCEPTS
SHARE FREE:
Liquidity Sweeps and Stop-Hunt Interpretations Explained
ICT Flow EditorialIndependent educational resource
This lesson explains concepts commonly taught in ICT/SMC trading education and presents them as frameworks to study and test. Chart patterns cannot independently prove institutional intent, future price delivery, or profitability. Examples and rules are educational, not trading advice.
Read our editorial standards →A common ICT interpretation is that price often interacts with liquidity, including resting orders around visible highs and lows. News, fundamentals, positioning, and other factors can also affect price; liquidity is not the only explanation.
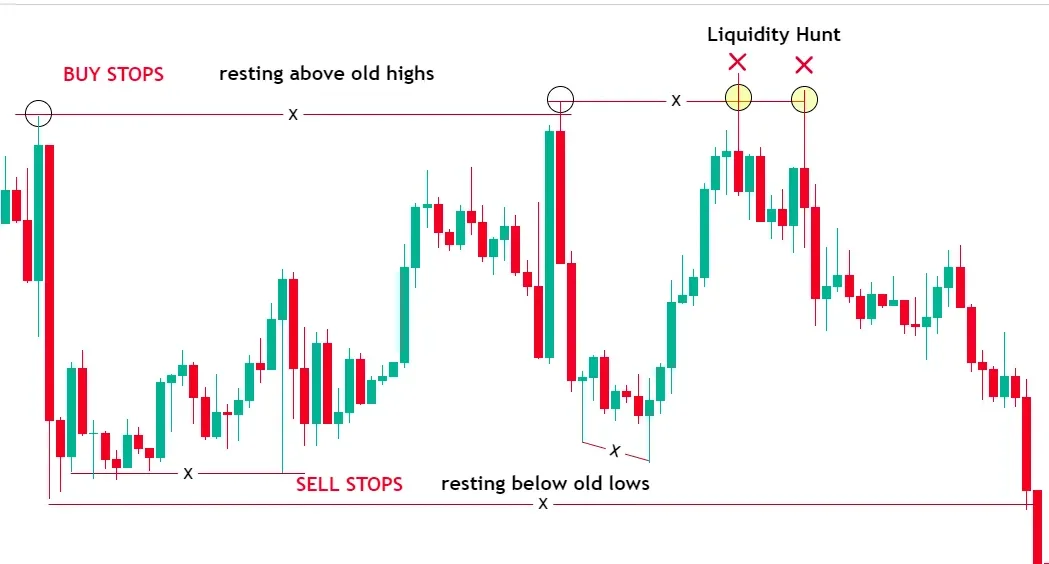
Buy-side liquidity (BSL) sits above highs, sell-side liquidity (SSL) sits below lows
// Lesson Content
In traditional finance, "liquidity" means how easily an asset can be bought or sold. In ICT education, liquidity is commonly used to describe areas where stop orders or other resting orders may cluster, such as around visible highs and lows. The location of actual participant orders is not directly observable from a chart.
Think about it this way. For illustration, consider a large EURUSD order. Large orders can face market-impact and liquidity constraints, and an ICT interpretation may describe price moving toward visible liquidity before a reversal. This example is a simplified model, not evidence that institutions deliberately engineer every move or that a reversal must follow.
This is a central ICT interpretation of liquidity; not every market move needs to be explained by a liquidity hunt.
📌 ICT commonly interprets liquidity sweeps as potential catalysts around turning points; institutional intent and a required stop hunt cannot be confirmed from price alone.
Buy-Side Liquidity (BSL) sits ABOVE price, at levels where:
• Retail traders have placed stop-losses on their short positions
• Buy-stop orders from breakout traders are waiting
• Equal highs or swing highs that everyone can see on the chart
Within the ICT framework, traders may study BSL as an area where sell-side liquidity and potential reactions can occur. Actual participant intent and the resulting direction are not directly observable from the chart.
You'll recognize BSL as: Equal Highs (EQH) on a chart, previous day/week highs, obvious resistance levels that everyone is watching, and round numbers like 1.1000 or 2000 on Gold.
A common liquidity-sweep example is price approaching BSL, briefly trading above it, then potentially reversing. ICT education may call this a "stop hunt" or "liquidity sweep," but the chart alone cannot establish that stops were deliberately targeted.
📌 A price spike above an obvious high followed by an immediate reversal may be interpreted as a BSL sweep; institutional order flow cannot be confirmed from the chart alone.
Sell-Side Liquidity (SSL) is the mirror image — it sits BELOW price, at levels where:
• Retail longs have their stop-losses
• Sell-stop orders from breakout sellers are resting
• Equal lows, swing lows, support levels
ICT teachings commonly interpret sell-side liquidity as an area where buy-side orders may be filled. Some ICT explanations describe price moving below obvious lows before reversing, but the chart alone cannot establish that institutions deliberately triggered stops or accumulated positions there.
You'll identify SSL as: Equal Lows (EQL), previous day/week lows, obvious support levels, and round numbers below current price.
A stop-loss can become part of available market liquidity when triggered, but a stop below support is not necessarily being targeted by banks or used to fill an institutional position.
📌 SSL is below commonly watched lows and BSL is above commonly watched highs. These levels can be studied for potential liquidity interactions; institutional intent is not directly observable.
ICT traders commonly study equal highs and lows as potential liquidity/reference areas. They can attract attention and may coincide with clustered orders, but the size and composition of resting stops cannot be known from the chart alone.
ICT teachings may interpret visible equal highs/lows as liquidity areas. Some traders may place stops or entries around these visible levels, but the exact orders present and the intentions of other participants cannot be known from the chart alone. A sweep can occur, but it does not establish who caused it or guarantee a reversal.
In ICT terminology: EQH = resting BSL above. EQL = resting SSL below. When you see equal highs or lows on your chart, your thought should be: "Some traders watch these levels for potential sweeps, but a sweep or reversal is not guaranteed."
📌 Equal Highs and Equal Lows can be studied as potential liquidity/reference areas; a sweep or reversal is not guaranteed.
The complete liquidity sweep trade setup:
Step 1 — Identify your HTF bias (bullish or bearish) using market structure.
Step 2 — Mark all visible BSL (above recent highs) and SSL (below recent lows) on your chart.
Step 3 — In a bullish bias, watch for price to sweep below SSL (a fake breakdown). This is the institution filling buys.
Step 4 — After the sweep, wait for a ChoCH or BOS to the upside on the LTF. This confirms the sweep is done and price is reversing.
Step 5 — Enter from a nearby FVG or OB that forms after the sweep/ChoCH.
A commonly studied ICT sequence is Liquidity Sweep → Structure Shift → Entry from a PD Array. It appears in several ICT-style models, but individual models and criteria differ.
📌 Example setup: SSL sweep → bullish structure shift → FVG/OB entry. Treat this as a testable setup, not a guaranteed or universally superior trade.
// Test Your Understanding
// KNOWLEDGE CHECK
1. Buy-side liquidity (BSL) is located...
2. What can happen after a liquidity sweep?
3. Equal Highs (EQH) in ICT represent...
// What to study next
Continue your ICT journey