Beginner📖 18 min read🏷 Foundation
MARKET STRUCTURE
SHARE FREE:
The Language of Price — How to Read What the Market Is Actually Saying
ICT Flow EditorialIndependent educational resource
This lesson explains concepts commonly taught in ICT/SMC trading education and presents them as frameworks to study and test. Chart patterns cannot independently prove institutional intent, future price delivery, or profitability. Examples and rules are educational, not trading advice.
Read our editorial standards →Before you can trade ICT, you need to understand one thing: price can exhibit recurring patterns and structure. Learning to read those patterns can provide a framework for interpreting charts. Market structure is the foundation of everything in ICT. It tells you the direction price is going, when that direction is changing, and when a new move is starting.
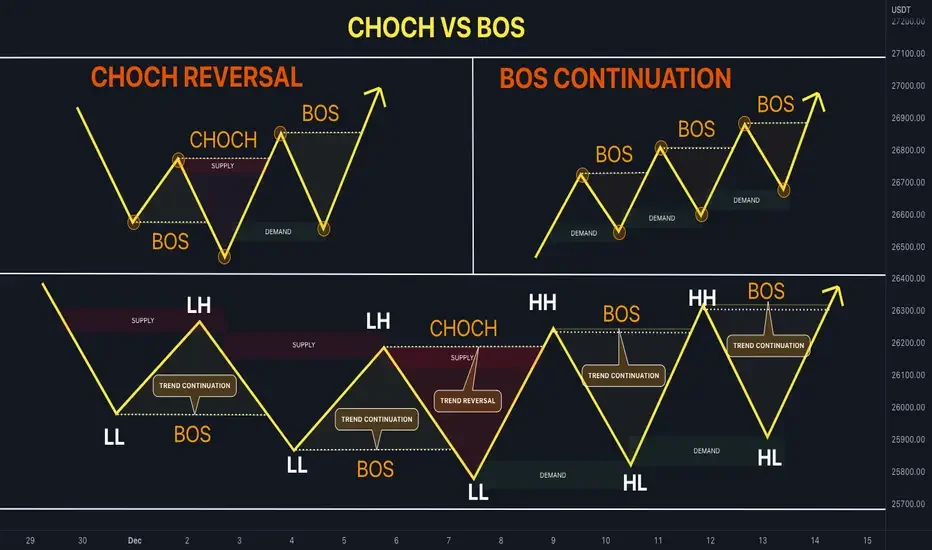
BOS vs ChoCH — the two most critical market structure signals in ICT
// Lesson Content
Market structure is the sequence of highs and lows that price creates as it moves. Those patterns can help traders describe whether recent price action is making higher highs and higher lows or lower highs and lower lows, but they do not by themselves reveal every participant's intent.
In an uptrend, price creates Higher Highs (HH) and Higher Lows (HL). Each new push up goes higher than the last. Each pullback stops higher than the previous pullback. Buyers are in full control.
In a downtrend, price creates Lower Highs (LH) and Lower Lows (LL). Each rally stops lower than the last. Each drop goes deeper. Sellers are in full control.
This sounds simple — and it is. Many retail traders struggle to apply this consistently. They try to buy in downtrends and sell in uptrends and wonder why they keep losing.
📌 Rule #1: Some traders filter setups by higher-timeframe structure; test whether this filter improves your results.
A Break of Structure (BOS) happens when price breaks through the most recent swing high (in an uptrend) or swing low (in a downtrend). It confirms that the current trend is continuing.
Here's how to identify a Bullish BOS: Price is in an uptrend (HH, HL sequence). Price pulls back, creates a new Higher Low. Then price pushes up and breaks above the last Higher High. That break above the previous swing high = BOS. This can support a continuation interpretation; any directional trade should still follow a defined, tested plan.
Bearish BOS is the opposite: price breaks below the most recent swing low, confirming continuation of the downtrend.
The BOS is not your entry signal — it's your confirmation that the trend is still running. Your entry comes from the pullback that follows.
📌 BOS is commonly used as a continuation reference in ICT analysis; it does not by itself confirm institutional intent or guarantee continuation.
This is where it gets powerful. A Change of Character (ChoCH) — also called a Market Structure Shift (MSS) — is the signal that the trend is REVERSING.
In a downtrend, price is making LH and LL. Then suddenly, price shoots up and breaks above the most recent Lower High. That break = ChoCH. It means buyers have stepped in aggressively enough to break the bearish structure. This can be an early sign that the prior downtrend may be weakening or changing.
In an uptrend, if price breaks below the most recent Higher Low in one aggressive move — that's a bearish ChoCH. Sellers just took control.
The key difference between BOS and ChoCH is direction:
• BOS breaks in the direction of the current trend = continuation
• ChoCH breaks AGAINST the current trend = potential reversal
This is one framework ICT traders use to study potential turning points; interpretations about institutional positioning are not directly observable from price alone.
📌 ChoCH = The first warning sign that trend is reversing. Don't jump in immediately — wait for confirmation and a PD Array to enter from.
ICT goes deeper than just "uptrend/downtrend." He breaks structure into two layers:
External Structure (swing highs/lows visible on your current timeframe) — these are the major turning points. They create the overall bias.
Internal Structure (the smaller movements WITHIN the external swings) — these are the Lower Timeframe (LTF) details that give you precise entries.
For example, you might be looking at a 1-hour bullish trend (external structure). Inside that, on the 5-minute chart, you'll see a mini downtrend creating the pullback. When that internal bearish structure shifts to bullish (internal ChoCH on 5min) — THAT is your precise entry trigger.
This nested view is one way ICT traders distinguish higher-timeframe context from lower-timeframe execution.
📌 Higher-timeframe context can inform bias while lower timeframes can refine entries. Test the exact sequence and rules that fit your strategy.
Here's the complete workflow:
Step 1 — Check the Daily chart. Is it making HH/HL (bullish) or LH/LL (bearish)? This is your macro bias. Use this as a directional filter if it is part of your tested plan.
Step 2 — Move to the 1-Hour or 4-Hour chart. Confirm the same structure direction. Look for where the last BOS happened to know how deep the pullback could go.
Step 3 — When price pulls back, drop to the 15-minute or 5-minute chart. Watch for a ChoCH in the direction of your HTF bias. This is your LTF confirmation.
Step 4 — After LTF ChoCH, look for a PD Array (FVG, OB, etc.) nearby to enter from. Set your stop below the swing low that caused the ChoCH.
This is one possible top-down analysis framework; traders can adapt the timeframes and rules to their instrument and tested plan.
📌 The trade entry is on the LOWER timeframe, but the bias comes from the HIGHER timeframe. This is a commonly emphasized ICT guideline; traders should test the timeframes and rules that fit their plan.
// Test Your Understanding
// KNOWLEDGE CHECK
1. In a downtrend, price creates...
2. A BOS (Break of Structure) signals...
3. A ChoCH in a downtrend means...
// What to study next
Continue your ICT journey