Advanced📖 55 min🏷 ICT
MARKET MAKER MODELS
SHARE FREE:
MMBM, MMSM and multi-day price behavior within the ICT framework
ICT Flow EditorialIndependent educational resource
This lesson explains concepts commonly taught in ICT/SMC trading education and presents them as frameworks to study and test. Chart patterns cannot independently prove institutional intent, future price delivery, or profitability. Examples and rules are educational, not trading advice.
Read our editorial standards →Market Maker Buy Model (MMBM) and Market Maker Sell Model (MMSM) are ICT frameworks for organizing multi-day price behavior. They are models for observation and testing, not proof of what banks or other institutions are actually doing. The goal is to define the sequence precisely enough to study it without turning a narrative into a certainty.
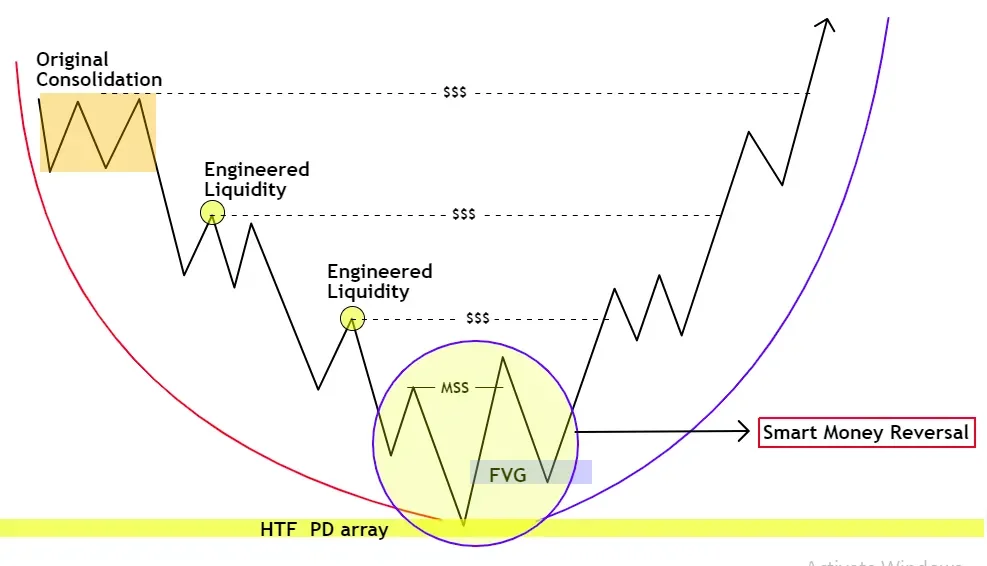
Market Maker Models are ICT teaching frameworks for studying multi-day price behavior; chart patterns do not reveal the actual positions or intentions of market participants.
// Lesson Content
The MMBM is commonly taught as a multi-day bullish narrative in which price first creates conditions that can be interpreted as bearish accumulation or liquidity building before a later move higher.
A useful study process is:
1. Mark the relevant higher-timeframe range and obvious liquidity.
2. Identify the sequence of daily highs and lows rather than assuming intent.
3. Record where price expands, retraces and displaces.
4. Define the exact level that would invalidate your interpretation.
5. Test the complete sequence over historical samples.
The chart can show price behavior. It cannot independently prove that a market maker accumulated a specific position.
📌 Treat MMBM as a testable price-delivery framework, not as evidence of confirmed institutional positioning.
The MMSM is the bearish counterpart used in ICT education to describe a multi-day sequence that may precede downward delivery.
Study it by mapping:
• The higher-timeframe dealing range
• External and internal liquidity
• Daily displacement and retracement
• The draw on liquidity you are testing
• The invalidation point
Do not label every multi-day decline as MMSM after the fact. Write the conditions before reviewing the outcome, then count both qualifying and non-qualifying examples.
📌 A valid study requires predefined rules. Otherwise, the model becomes a hindsight label that can be attached to almost any chart.
ICT teachings use terms such as False Flag and Seek & Destroy to describe deceptive or range-bound price behavior around particular sessions or days.
For a test, define:
• The day or session being studied
• The reference range
• What counts as the false move
• What confirms the subsequent direction
• The target and invalidation
A Friday that behaves differently from the rest of the week is not automatically a Seek & Destroy or TGIF pattern. The label should only be applied when the predefined conditions are present.
📌 Narrative labels are useful only when they become measurable rules. Do not convert an interesting chart story into a trading rule without testing it.
A disciplined study can use a simple worksheet:
1. Instrument and date
2. Higher-timeframe range
3. Liquidity references
4. Model phase observed
5. Entry trigger, if any
6. Invalidation
7. Target
8. Result in R
9. Screenshot before and after
10. Notes on whether every rule was present
Compare the model with a neutral benchmark instead of assuming it has an edge. Include missed setups and losing examples so the sample is not selected for attractive outcomes.
📌 The objective is not to prove the model. The objective is to find out whether a precisely defined version produces repeatable results after costs and execution constraints.
Seek & Destroy and TGIF discussions often focus on Friday behavior. Use weekly context first: previous-week high and low, weekly range, open gaps and the current draw on liquidity.
Do not assume Friday must reverse or consolidate. Markets can trend, gap, compress or reverse on any day. A weekly narrative is a hypothesis; price action determines whether the predefined setup actually occurs.
📌 Weekly context can organize the hypothesis, but it should never override the actual entry and invalidation rules of the tested model.
// Test Your Understanding
// KNOWLEDGE CHECK
1. What can a Market Maker Model legitimately establish from a chart?
2. What should be defined before testing MMBM or MMSM?
3. What is the best way to evaluate a model?
// What to study next
Continue your ICT journey