Advanced📖 75 min🏷 NEWER
ICT MENTORSHIP — NEWER CONCEPTS
SHARE FREE:
Venom, Propulsion Blocks, quarterly shifts and newer ICT concepts
ICT Flow EditorialIndependent educational resource
This lesson explains concepts commonly taught in ICT/SMC trading education and presents them as frameworks to study and test. Chart patterns cannot independently prove institutional intent, future price delivery, or profitability. Examples and rules are educational, not trading advice.
Read our editorial standards →This module collects newer concepts associated with ICT's 2024-era teaching, including the Venom Model, Propulsion Blocks, Quarterly Shifts, SCOB, QML and weekly profile templates. Because terminology and examples can evolve, treat the source material as the definition of the model and separate documented rules from your own interpretation.
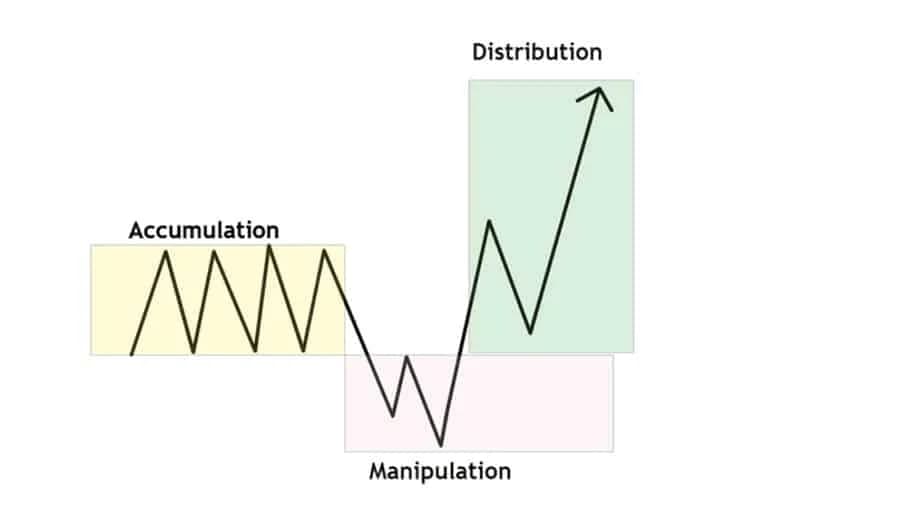
Newer ICT concepts can be studied as defined frameworks, but labels and interpretations should be checked against the source material and tested before use.
// Lesson Content
The Venom Model is a time-based ICT framework that combines session context, liquidity and price delivery into a defined setup sequence. When studying it, record the exact session window, liquidity condition, displacement or structure condition, entry trigger, invalidation and target from the source material you are following.
Do not add a rule simply because it appears to improve historical examples. If you modify the model, label it as your own variant and test it separately.
📌 Keep the published model and your personal variation separate. Otherwise you cannot tell which rules produced your results.
A Propulsion Block is a price-action concept used to describe a zone associated with continuation after a displacement. The exact identification rules matter more than the label.
For a test, specify which candle or range qualifies, what confirms the block, where the invalidation sits and what target is expected. Avoid marking every continuation candle as a Propulsion Block after the move has already happened.
📌 A zone is only useful as a trading rule when its identification and invalidation can be applied before the outcome.
Quarterly Shift concepts focus on changes around the start of a new calendar quarter. Mark the relevant quarterly reference and study how price behaves around it without assuming that every quarter produces a reversal.
Compare several quarters and include both directional and non-directional examples. Seasonality-like narratives can be interesting, but the sample determines whether they add measurable value.
📌 Calendar timing can be studied as context; it should not be treated as a guaranteed directional signal.
SCOB (Silver Bullet Order Block) and QML (Quasi Market Level) are newer terminology that can be incorporated into an ICT study process.
For either concept, preserve the source definition and then create a checklist: location, structure, liquidity, trigger, invalidation and target. If your definition differs from the source, document the difference.
📌 New terminology is not automatically a new edge. Define it precisely, then test whether it adds information beyond your existing model.
Weekly profile templates organize expectations around how price may behave during different parts of the trading week. They are useful as hypotheses for planning, but the actual week can deviate substantially from a template.
Use the template to prepare scenarios rather than to force price into a predetermined narrative. Record which scenario occurred and which did not.
📌 A profile is a planning framework. Let actual price invalidate the scenario instead of forcing the chart to match the template.
// Test Your Understanding
// KNOWLEDGE CHECK
1. How should newer ICT concepts be handled when testing them?
2. What is the purpose of separating a source model from your variation?
3. How should weekly profile templates be used?
// What to study next
Continue your ICT journey