Advanced📖 50 min🏷 ICT
IPDA & CRT
SHARE FREE:
IPDA theory, lookback ranges, gaps and Candle Range Theory
ICT Flow EditorialIndependent educational resource
This lesson explains concepts commonly taught in ICT/SMC trading education and presents them as frameworks to study and test. Chart patterns cannot independently prove institutional intent, future price delivery, or profitability. Examples and rules are educational, not trading advice.
Read our editorial standards →IPDA (Interbank Price Delivery Algorithm) and Candle Range Theory (CRT) are ICT frameworks for interpreting price delivery, time and liquidity. These ideas can organize chart study, but a chart cannot independently verify the existence, intent or operation of a specific market algorithm.
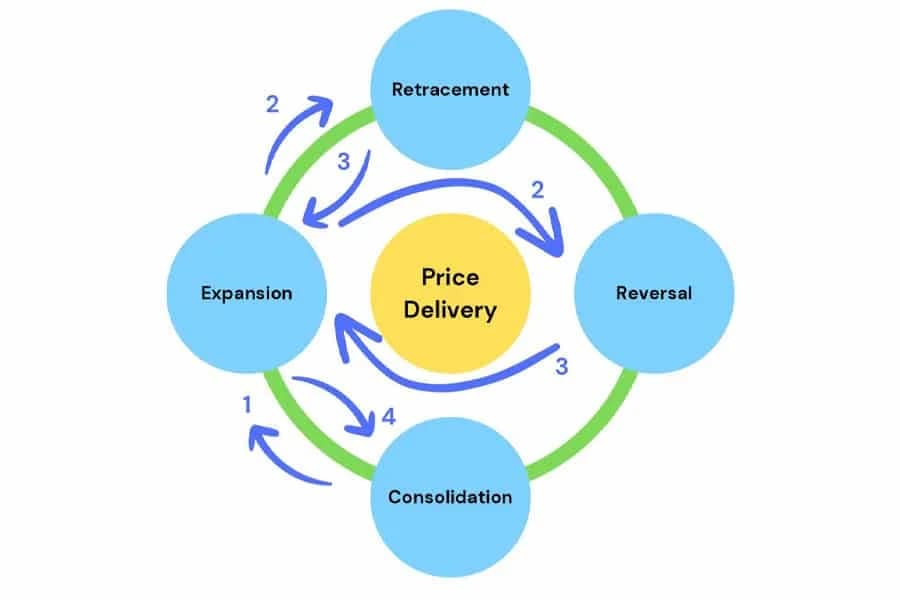
IPDA and Candle Range Theory are educational frameworks for studying time and price behavior; they are not verified descriptions of a market-moving algorithm.
// Lesson Content
ICT teachings commonly use 20-, 40- and 60-trading-day lookback windows when studying higher-timeframe price delivery.
For a repeatable study, mark the highs and lows associated with each window and record whether price later interacts with those levels. Do not assume every marked level is a required future target. The useful question is whether the rule adds predictive or contextual value in your tested sample.
📌 Lookback levels are reference points for testing, not guaranteed destinations.
NWOG refers to a New Week Opening Gap, commonly measured between the prior Friday close and the new week's open. NDOG refers to a New Day Opening Gap, measured according to the specific daily reference convention used in your plan.
Timezone and session definitions matter. Write down exactly which close and open you use so the same rule is applied every day.
A gap can act as a reference level, but there is no guarantee that price will fill it.
📌 Define the exact session and timezone before testing NWOG or NDOG. Do not treat a gap fill as guaranteed.
CRT is commonly taught around a range-forming candle and the idea that a later candle may sweep one side of that range before delivering toward the opposite side.
A simple test requires fixed rules for:
• The reference candle timeframe
• The range high and low
• What counts as a sweep
• What confirms the directional move
• Entry, invalidation and target
The model should be evaluated across many examples rather than selected from the cleanest historical charts.
📌 CRT becomes testable only when the reference candle, sweep and confirmation rules are defined in advance.
A weekly draw on liquidity is a hypothesis about which meaningful high or low price may seek during the week. Candidates can include previous-week extremes, equal highs/lows, higher-timeframe gaps or other predefined liquidity references.
Choose one rule for selecting the draw. If you change the target after seeing price action, the analysis becomes hindsight rather than a test.
📌 A draw on liquidity is a hypothesis about a target, not a promise about where price must go.
One disciplined workflow is to use higher-timeframe lookback levels for context, weekly liquidity for the broader target, and CRT only when its exact conditions appear.
Keep the layers separate. If the higher-timeframe hypothesis is invalidated, the lower-timeframe entry should not be rescued by changing the narrative.
📌 Separate context, setup and target. This prevents one attractive chart story from overriding invalidation rules.
// Test Your Understanding
// KNOWLEDGE CHECK
1. What are the commonly taught IPDA lookback windows?
2. What does NWOG commonly reference?
3. What makes a CRT idea testable?
// What to study next
Continue your ICT journey