Power of Three (AMD Model) — How Price Is Delivered Every Single Day
Accumulate, Manipulate, Distribute. This three-phase model describes how institutional money operates on every timeframe, every day. Understanding it changes how you see every candle on every chart.
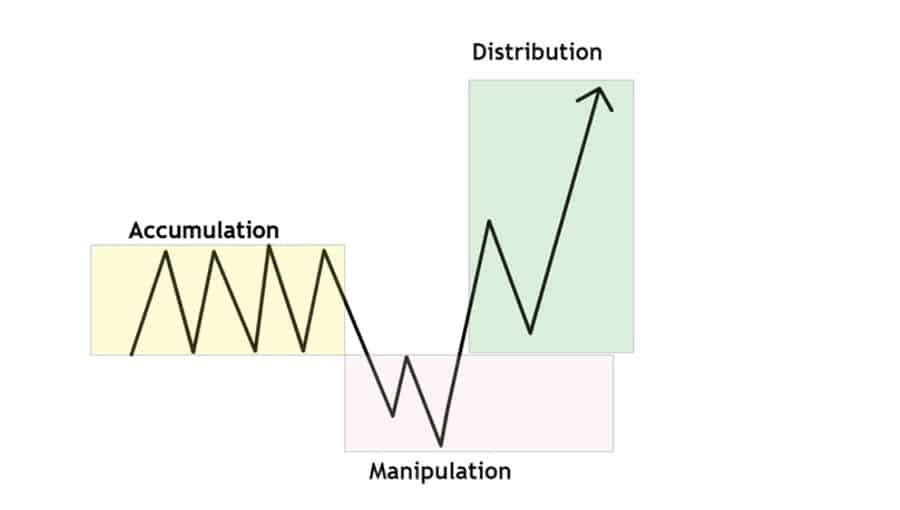
The Power of Three — also called the AMD Model — is ICT's framework for understanding how price is delivered on any timeframe. Accumulation, Manipulation, Distribution. Every daily candle follows this pattern. Every weekly candle. Every monthly candle. Even every 1-minute candle within a larger session contains its own AMD cycle. Once you see it, you cannot unsee it — and the market will never look random again.
Phase 1: Accumulation — Building the Position
The Accumulation phase is when institutions are building their positions. Price consolidates — moving within a relatively tight range without strong directional bias. This is not random indecision. It is deliberate. Institutions cannot buy or sell billions of dollars worth of positions in a single instant without moving price catastrophically against themselves. They need time to gradually accumulate positions at acceptable average prices.
The Accumulation phase on a daily timeframe typically corresponds to the Asian session — where price oscillates within the Asian Range while European and American institutions are preparing their orders. On a weekly basis, Monday is often the Accumulation day. On a monthly basis, the first week is often the Accumulation week.
Phase 2: Manipulation — Engineering the False Move
The Manipulation phase is the most important phase for ICT traders to recognize because it is where retail traders are systematically trapped. Having completed their accumulation, institutions need to clear the market of opposing orders before delivering price to their target. They do this through a deliberate false move in the opposite direction of their intended trade.
If institutions are positioned long and want to deliver price higher, they will briefly push price lower — sweeping the stop losses of retail longs and triggering the entries of retail short sellers. These retail shorts become the institutional buy orders needed to fuel the upward delivery. This false move lower IS the Judas Swing. It is not a reversal — it is a liquidity collection mechanism that sets up the real move.
The Manipulation phase on a daily timeframe corresponds to the London session — the most deceptive session of the day. During London, a Judas Swing frequently sweeps either the Asian High or Asian Low before the day's real direction is established. On a weekly basis, Tuesday is often the Manipulation day — creating a false move against Monday's direction before the week's primary trend develops.
Phase 3: Distribution — Delivering to the Target
The Distribution phase is when institutions deliver price to their target — the external liquidity level (ERL) that has been the objective since the Accumulation phase began. During Distribution, price moves decisively in one direction with clear displacement — large-bodied candles, FVGs embedded in the move, and minimal retracement against the trend.
The Distribution phase on a daily timeframe corresponds to the New York AM session — the primary delivery window. On a weekly basis, Wednesday through Thursday are typically the Distribution days where the week's primary trend is delivered. On a monthly basis, the middle weeks of the month are typically the Distribution phase.
Reading the Daily Candle as an AMD Structure
Every daily candle contains within it a complete AMD cycle that, once understood, tells you exactly what happened that day in institutional terms. The Open of the daily candle is not random — it is the starting reference point for the day's entire delivery sequence. ICT uses the "True Daily Open" — midnight New York time — as the reference rather than the exchange open.
- diamondBullish AMD Day: Opens near the low (accumulation), Manipulation moves lower into SSL (sweeping stop losses of longs), Distribution delivers to BSL target above — candle closes near its high
- diamondBearish AMD Day: Opens near the high (accumulation), Manipulation moves higher into BSL (sweeping stop losses of shorts), Distribution delivers to SSL target below — candle closes near its low
- diamondThe body of the daily candle represents the real move; the wicks represent the manipulation phases
- diamondThe bigger the wick in one direction, the more liquidity was swept during that phase — higher quality manipulation equals cleaner distribution
AMD on Higher Timeframes — Weekly and Monthly
The AMD model fractal nature is one of its most powerful characteristics. The same three-phase pattern that describes a single day also describes an entire week, and a week's pattern describes an entire month, and a month's pattern describes a quarter. ICT teaches traders to read AMD on multiple timeframes simultaneously to understand where the market is in its delivery cycle at any given moment.
A trader who understands that we are in the Distribution phase of a weekly AMD cycle (Wednesday-Thursday delivery to an external target) will not be confused when daily charts show manipulation moves against the trend — they understand those daily manipulations are simply the internal AMD cycles within the larger weekly distribution.
Practice identifying AMD on completed daily candles first. Look at yesterday's candle: where did it open? Did it make a false move in one direction early? Then where did it close? Once you can consistently identify AMD in completed historical candles, begin watching for the pattern in real time.