Liquidity in ICT Trading: Chart References and Market Drivers
Explore how ICT traders use buy-side and sell-side liquidity references, why visible levels do not reveal every order or participant motive, and how to test target hypotheses against broader market context.
Framework note: ICT terms are interpretations of price action, not proof of institutional motives or a market algorithm’s intent. No setup is guaranteed. Test clearly defined rules, account for costs and slippage, and use risk limits before risking capital. Read our editorial policy.
One ICT interpretation is that price may move toward areas where orders cluster. This is one lens for analyzing price action, not a replacement for supply and demand, news, positioning or ordinary order flow. Large participants may seek liquidity when executing large orders, but the chart alone cannot prove that a move was engineered to trigger retail stops or identify who filled which orders. Treat this explanation as a hypothesis to test before reversing.
What Liquidity Actually Means in Markets
In financial markets, liquidity refers to the availability of orders to trade against. When you buy, someone must sell to you. When you sell, someone must buy from you. Retail traders provide liquidity through their stop losses — when a stop loss is triggered, it creates a market order that the institution on the other side of the trade can fill against.
Large market orders can consume available liquidity and affect prices, depending on depth and conditions. Candle charts alone do not establish that banks engineer scenarios to trigger retail stops or create orders they need to fill; distinguish an ICT interpretation from observable market data.
Buy-Side Liquidity (BSL) — Where the Stops Are Above Price
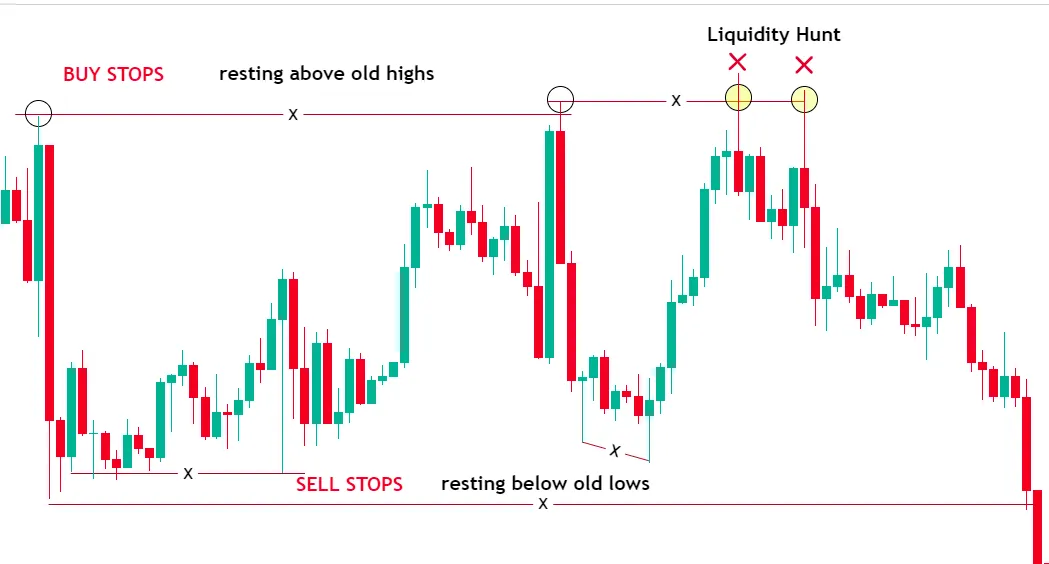
Buy-Side Liquidity consists of buy-stop orders and stop losses from short sellers clustered above current price. These exist at swing highs, at equal highs, above round numbers, at previous day highs, previous week highs, and at any level where retail traders are likely to have placed their stop losses on short trades or their buy-stop entries for breakout strategies.
Some ICT traders interpret a move above a prior high as a possible buy-side liquidity sweep. The chart does not reveal an algorithm's target or prove that all buy stops were triggered; price may continue higher, reverse or consolidate.
Sell-Side Liquidity (SSL) — Where the Stops Are Below Price
Sell-Side Liquidity consists of sell-stop orders and stop losses from long traders clustered below current price. These exist at swing lows, at equal lows, below round numbers, at previous day lows, and at any level where long traders have placed their stop losses.
Equal Lows (EQL) and Equal Highs (EQH) are among the most important liquidity reference points in ICT methodology. When price creates two or more lows at approximately the same level, every retail trader who can see the chart knows those lows are significant support. This means every long trader in that position has their stop loss just below those lows — creating a massive pool of Sell-Side Liquidity that the algorithm is almost certain to target before a major reversal.
Liquidity Engineering — The Deliberate Creation of Traps
Some ICT educators use the phrase liquidity engineering to interpret moves through visible highs and lows. This is a hypothesis about price behavior, not evidence that institutions deliberately create retail patterns or target specific traders.
One ICT hypothesis is that a move below a visible low may trigger sell orders before price rebounds. The chart does not establish that institutions engineered the move or used those orders to enter positions; record reversals and continuations when testing the pattern.
- Stop Hunt — Price temporarily moves beyond a significant level to trigger stop losses, then immediately reverses
- Turtle Soup — A stop hunt above a previous high or below a previous low followed by a sharp reversal in the opposite direction
- Judas Swing — The initial move of the session in the WRONG direction to collect liquidity before the real directional move
- HRLR vs LRLR — High Resistance Liquidity Runs face multiple obstacles; Low Resistance Liquidity Runs have clear paths with no opposing structure
- Internal vs External Liquidity — Internal liquidity sits within the current range (FVGs, OBs); External liquidity sits outside the range (swing highs/lows)
How to Use Liquidity Levels in Your Trading
The practical application of liquidity analysis involves three steps: first, identify where liquidity is resting above and below current price; second, determine which pool the algorithm is likely to target next based on HTF context and the current AMD phase; third, position yourself to benefit from the move into that liquidity rather than being caught on the wrong side of it.
Stop placement should follow a defined invalidation rule and position-sizing plan. Orders may cluster around visible highs and lows, but that does not mean a stop will be deliberately targeted. A wider stop also increases risk unless position size is adjusted.
The single most important liquidity concept to internalize: price does not move from support to resistance. Price moves from one liquidity pool to the next. Every move you see on any chart is a delivery from the last liquidity pool that was collected to the next one that needs to be reached.
Worked hypothetical example: observe a marked liquidity area
Suppose two visible highs form near 1.0850. Before the next session, a trader defines an equal-high tolerance of five pips and marks the band. Price later trades to 1.0857 and closes back below 1.0850. That path may be classified as a sweep under the rule, but the chart cannot confirm that stop orders were present, who held them, or that a participant deliberately targeted them.
Failure case and what to test
Price may continue above the highs, make repeated crossings, or remain near the level. Changing the tolerance or the observation horizon can change the classification dramatically. Test those choices prospectively and avoid using a sweep alone as an entry trigger.
Test checklist
- Set the instrument, timeframe, high/low tolerance and crossing definition.
- Record the close location and price path after the crossing.
- Count continuations and ranges as well as reversals.
- Use a defined horizon and include transaction costs in any strategy test.
RELATED READING
Continue with guides selected for overlapping concepts and practical context.