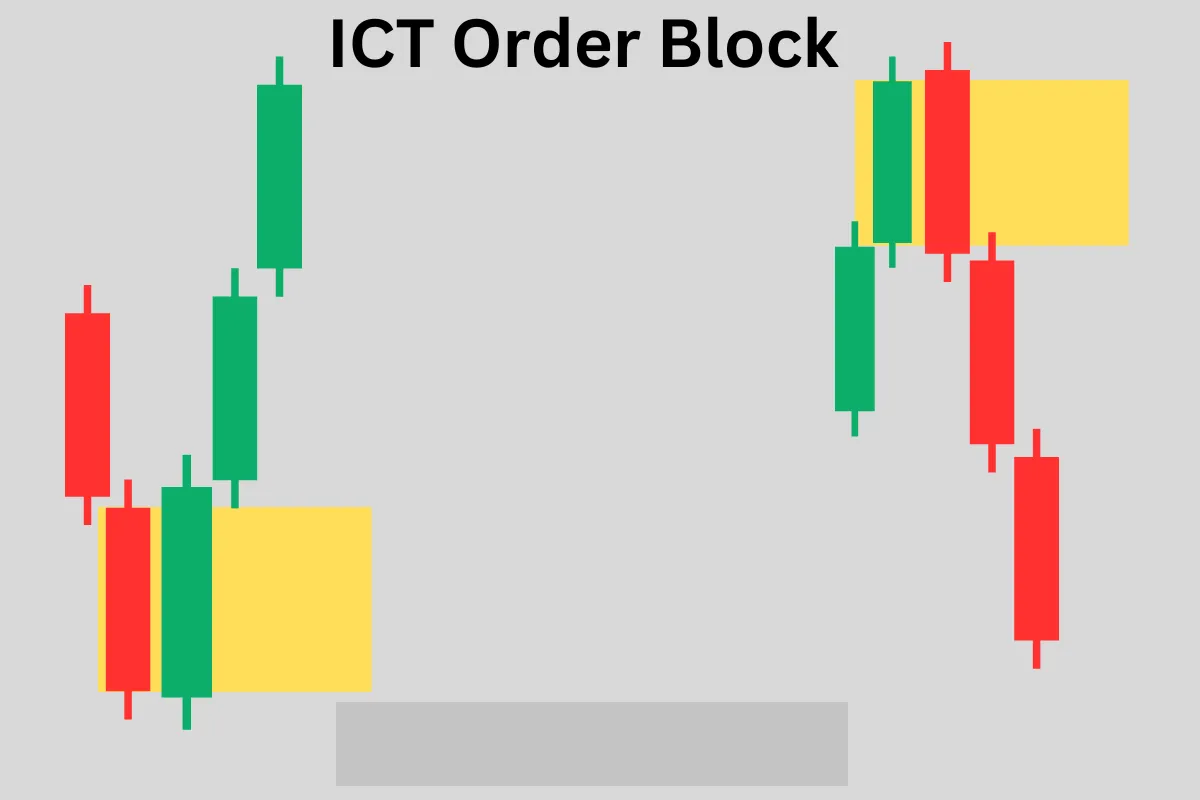
Supply and Demand vs ICT: Comparing Zone-Based Chart Frameworks
Compare supply-and-demand zones with ICT labels such as order blocks and FVGs, define each framework consistently, and test outcomes without assuming zones reveal unfilled institutional orders or a validated edge.
Framework note: ICT terms are interpretations of price action, not proof of institutional motives or a market algorithm’s intent. No setup is guaranteed. Test clearly defined rules, account for costs and slippage, and use risk limits before risking capital. Read our editorial policy.
Supply and Demand trading is one of the most popular retail trading methodologies — and it is the direct predecessor to ICT's Smart Money Concepts. Understanding supply and demand in the traditional sense, and then seeing how ICT elevates and refines those concepts into a more precise institutional framework, gives you the full context for why ICT works where standard S&D trading often falls short.
Traditional Supply and Demand Zones
In traditional S&D trading, a supply zone is an area of strong selling where price previously reversed downward sharply — characterized by a tight consolidation ("base") followed by a rapid move down. A demand zone is the opposite: a tight consolidation followed by a rapid move up. Traders mark these zones and buy at demand zones (expecting the buying pressure that previously reversed price there to activate again) and sell at supply zones.
Supply-and-demand zones are chart areas defined from prior price movement. A later reaction does not prove that institutional orders remain there or that previous orders will activate again; both holding and failing zones should be measured.
How ICT Improves S&D — The Key Advances
ICT and traditional supply-and-demand approaches use different zone definitions and filters, but candles alone do not verify that either zone contains institutional orders. Compare clearly written versions of each method against the same sample.
An FVG adds a specific candle-geometry condition to a chart rule. It does not show that price must return to fill an imbalance or that the condition provides a probabilistic edge; test it against a baseline with costs included.
Premium/discount location can be evaluated as an added filter on supply-and-demand zones. Do not assume the filter removes most failed entries; measure its effect on the same set of otherwise eligible trades.
A failed zone can be described through the price path that broke it, but the chart does not establish that it was used to exit institutional positions or that the failure was a predictable liquidity event.
Practical Comparison — S&D Entry vs ICT Entry
- S&D entry: buy anywhere in the demand zone (potentially 30-50 pips wide). ICT entry: buy at the CE of the OB candle body (specific pip level).
- S&D stop: below the demand zone (wide stop). ICT stop: below the OB candle low (tighter stop = better R:R).
- S&D filter: none for premium/discount. ICT filter: only buy in discount (below 50% of range).
- S&D zone validation: the zone is valid until it fails. ICT: validate the zone is still institutional via the displacement quality and check for prior mitigation.
- S&D on failure: "the zone failed, move on." ICT on failure: "the zone is now a Mitigation Block — it will flip to resistance and become a short entry on the retest."
If you come from a Supply and Demand background, ICT will feel immediately intuitive because the core logic is the same — institutional orders exist at specific zones that produce reactions. The ICT advancement is in the precision of identification, the filter framework (premium/discount), and the lifecycle management (OB → Mitigation Block → Breaker Block). Apply your S&D experience as the foundation and layer ICT precision on top — you will immediately improve your entry accuracy and your understanding of why zones succeed or fail.
Worked hypothetical example
A trader marks one supply zone using a preselected base-and-move rule, then marks an ICT order block using a different written candle-sequence rule on the same chart. The zones overlap partially but are not identical. The trader logs reactions to each zone separately rather than assuming the newer label is superior.
Failure case and what to test
Terms may overlap without referring to identical rules, and the labels alone cannot prove that one method identifies institutional activity. Choosing only zones that later react exaggerates the apparent skill of either framework.
Test checklist
- Define both zone types without referring to subsequent price action.
- Record overlapping and non-overlapping candidates.
- Compare both methods using the same sample and outcome metric.
RELATED READING
Continue with guides selected for overlapping concepts and practical context.