ICT Reversal Patterns: Three Setups and Their Limits
Review three reversal concepts in ICT education, define the chart conditions clearly and distinguish a hypothesis from a confirmed change in market direction.
Framework note: ICT terms are interpretations of price action, not proof of institutional motives or a market algorithm’s intent. No setup is guaranteed. Test clearly defined rules, account for costs and slippage, and use risk limits before risking capital. Read our editorial policy.
Identifying market reversals is the single most valuable — and most dangerous — skill in trading. Valuable because catching a reversal at the right moment gives you the lowest-risk, highest-reward entry of the entire move. Dangerous because most apparent reversals are simply retracements within the existing trend, and trading them counter-trend results in a string of losses. ICT teaches three specific reversal patterns that distinguish genuine algorithm-driven reversals from counter-trend noise.
Reversal Pattern 1 — The Liquidity Sweep Reversal
The Liquidity Sweep Reversal is the most common and reliable ICT reversal pattern. It occurs when price moves to a significant liquidity pool — an equal high, an equal low, a previous day's high/low, a swing extreme — and sweeps beyond it to trigger the stop orders, then immediately and sharply reverses back in the opposite direction.
The key to identifying this as a genuine reversal is the nature of the price action immediately after the sweep. A genuine reversal is characterized by: (1) a decisive sweep of the liquidity level (price closes beyond it, not just wicks), (2) an immediate large-bodied reversal candle or series of candles, and (3) a Market Structure Shift on the lower timeframe confirming the new direction. These three elements together define the Liquidity Sweep Reversal.
Reversal Pattern 2 — The Wyckoff Spring/Upthrust Adapted
ICT's adaptation of the Wyckoff Spring and Upthrust is based on the same accumulation/distribution framework. The Spring occurs at the end of an accumulation range — price briefly breaks below the range support (appearing to break down, triggering sell stops), then quickly reverses back inside the range and accelerates upward. The "spring" refers to the compression and release of institutional accumulation.
The ICT Upthrust is the bearish mirror — at the end of a distribution range, price briefly breaks above the range resistance (appearing to break out, triggering buy stops), then immediately reverses back inside the range and accelerates lower. Both patterns require the same confirmation: the reversal back inside the range must be aggressive, displacement-quality price action, not a slow grind.
Reversal Pattern 3 — The SMT + Structure Break Reversal
The most sophisticated reversal pattern combines SMT Divergence with a structural break. This occurs when one correlated instrument (say EURUSD) makes a new swing extreme while the correlated instrument (GBPUSD) fails to confirm the new extreme — the SMT Divergence. Simultaneously, both instruments show a Market Structure Shift on the lower timeframe, confirming the reversal.
The convergence of SMT Divergence (the institutional signal) with the lower timeframe MSS (the structural confirmation) creates an potential reversal signal. The SMT reveals the manipulation; the MSS confirms the new delivery direction has begun.
What Distinguishes a Reversal from a Retracement
- Reversals involve a clear liquidity sweep — price took out a significant level before turning. Retracements do not involve liquidity sweeps.
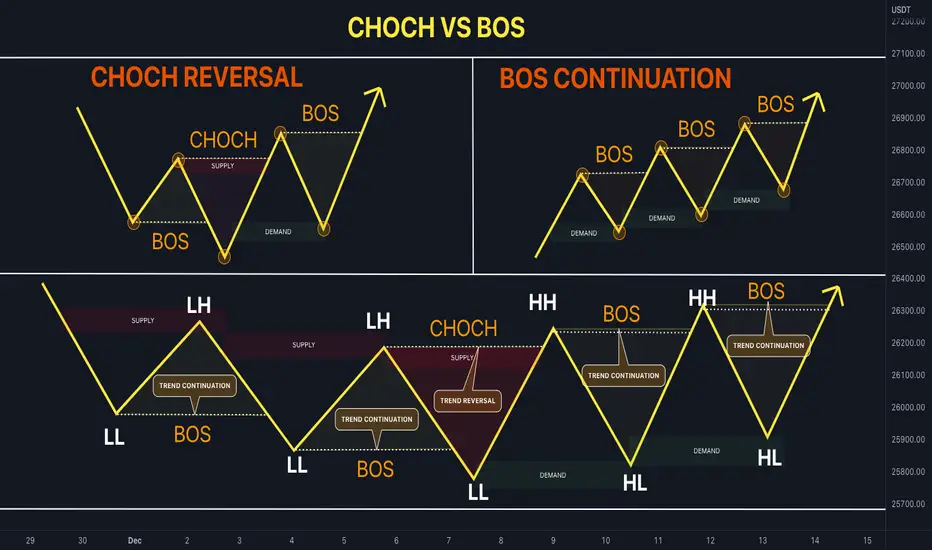
- Reversals show a Market Structure Shift on the lower timeframe. Retracements maintain the higher timeframe structure throughout.
- Reversals produce displacement candles in the new direction — large-bodied, minimal overlap. Retracements produce overlapping, corrective candle patterns.
- Reversals occur at significant PD Array elements (OBs, FVGs, key levels). Retracements often occur at arbitrary price levels.
- Reversals change the Draw on Liquidity — after a genuine reversal, the DOL is in the opposite direction. Retracements preserve the existing DOL.
The most important filter for any reversal trade: does the reversal change the Draw on Liquidity? After a genuine reversal at a swing high, the DOL is now below (toward the nearest swing low or equal lows). If the nearest liquidity pool is above rather than below the potential reversal point, you are not looking at a genuine reversal — you are looking at a trap.
Worked hypothetical example
A trader records three candidate reversal structures from a historical chart using fixed swing and confirmation rules. Two reverse modestly, while one continues in the original direction. The trader retains all three cases and checks whether the separate entry rule would have been triggered before judging the pattern.
Failure case and what to test
Reversal labels are often applied after the turn is visible. Trend strength, scheduled news and range context can change outcomes, and the same candle sequence may produce very different results across instruments.
Test checklist
- Write the reversal and invalidation conditions before reviewing charts.
- Count failed reversals and continuation cases.
- Include entry timing, spread and slippage when assessing outcomes.
RELATED READING
Continue with guides selected for overlapping concepts and practical context.