ICT RDRB — Redelivered Rebalanced Price Range Explained
The RDRB is an advanced hidden PD Array that forms when price redelivers into a zone it previously created as a Fair Value Gap, then rebalances it. Understanding RDRB reveals institutional intent at key turning points.
Framework note: ICT terms are interpretations of price action, not proof of institutional motives or a market algorithm’s intent. No setup is guaranteed. Test clearly defined rules, account for costs and slippage, and use risk limits before risking capital. Read our editorial policy.
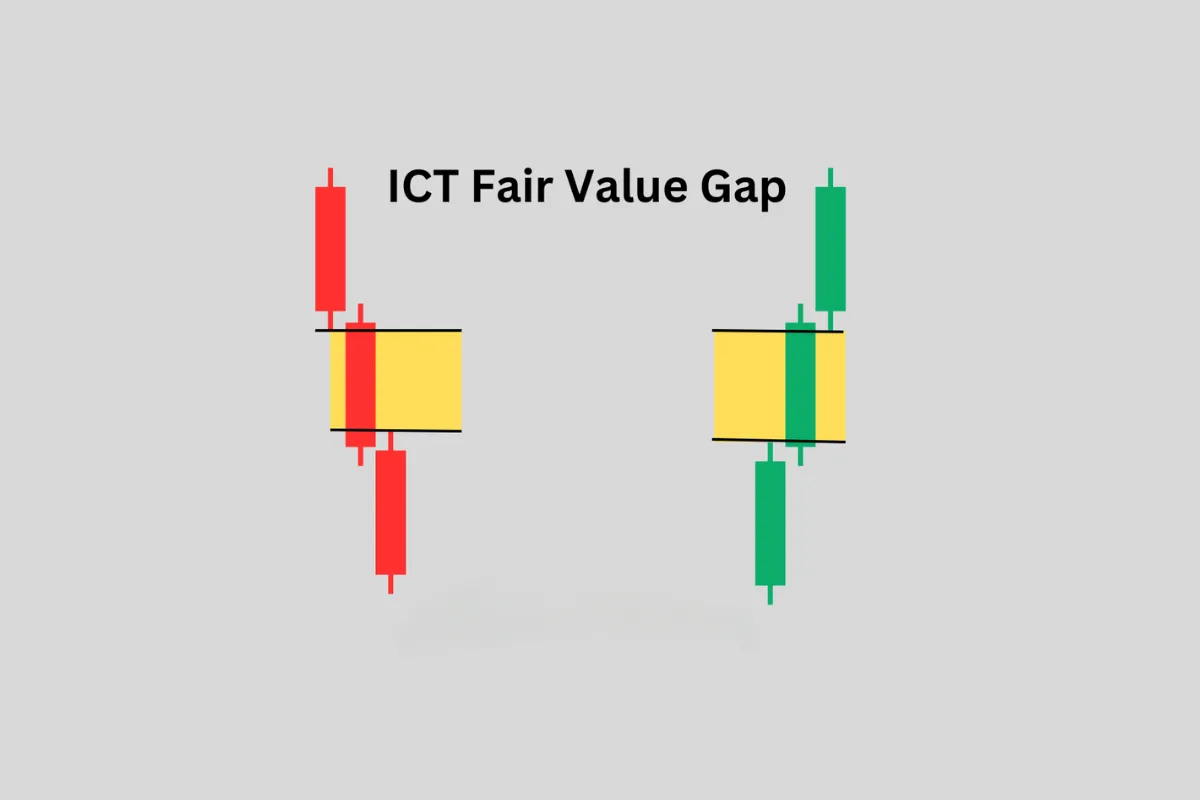
The ICT Redelivered Rebalanced Price Range (RDRB) is one of the more nuanced concepts in ICT methodology — a hidden PD Array that forms when price creates a Fair Value Gap, later returns to rebalance (fill) that FVG, and then delivers price back through the same zone again. This redelivery through the previously rebalanced zone creates a specific structure that acts as a potent institutional level on all subsequent returns.
The RDRB Formation Sequence
The RDRB requires a specific three-part sequence. Part One: a Fair Value Gap forms from a displacement move. Part Two: price returns to that FVG and fully rebalances it — filling the entire gap from near edge to far edge. The FVG is now fully mitigated. Part Three: price delivers back through the zone where the FVG was. This redelivery through the previously mitigated FVG zone creates the RDRB — the zone now has a new type of institutional significance.
The logic: the original FVG represented an area of imbalance. When price returned and filled it, the imbalance was resolved. But when price then passes through the same zone again in the original direction, it is redelivering through a previously balanced range. Institutions who were waiting at the FVG have had their orders filled, and now the zone acts as a confirmed area of institutional participation — a more robust support or resistance than the original FVG because it has been tested and filled once already.
Identifying RDRB on Your Chart
- Mark all significant FVGs on your chart.
- Monitor which FVGs get fully filled (price trades completely through the gap — both edges).
- When a fully filled FVG is later revisited by price from the original direction (the direction of the displacement that created the FVG), mark this zone as an RDRB.
- The RDRB zone is defined by the original FVG boundaries (the high of candle 1 and the low of candle 3, or vice versa for bearish).
- Treat the RDRB zone as a PD Array element — look for entries within it when price returns with a lower timeframe reaction confirmation.
RDRB Compared to Standard FVG
A standard FVG is an active imbalance awaiting its first fill. An RDRB is a previously filled imbalance that is being re-engaged. The standard FVG has a single layer of institutional significance — the unfilled orders from the displacement. The RDRB has a double layer — the original institutional significance of the FVG plus the additional significance of having been fully rebalanced (meaning institutions confirmed their presence there by filling it) and then re-approached.
Trading the RDRB
RDRB entries follow the same confirmation model as other PD Arrays. When price enters the RDRB zone, switch to the lower timeframe and look for a displacement and FVG forming within the RDRB zone. Enter at the CE of the lower timeframe FVG. Stop: beyond the RDRB zone. Target: the next external liquidity pool.
RDRBs are commonly discussed on the 1-hour and 4-hour timeframes, where the original FVG was significant enough to represent genuine institutional imbalance. A 1-minute FVG that fills and then creates an RDRB carries far less weight. Always contextualize the RDRB by the timeframe significance of the original FVG.
Worked hypothetical example
In a hypothetical chart review, a trader marks an imbalance zone, observes price trade through it, and then applies a written RDRB definition to a later move back across the same area. The next step is to log the candidate zone and test whether the predefined entry trigger occurs. A visual resemblance alone is not enough to count it as a valid setup.
Failure case and what to test
Specialist ICT terminology can vary between educators. If the candle sequence, boundaries or required reclaim are vague, different traders may label the same chart differently. Freeze one definition before the sample and note borderline cases separately.
Test checklist
- Document the exact pattern sequence and zone boundaries.
- Separate pattern identification from the later entry trigger.
- Compare outcomes with ordinary FVG and no-trade baselines.
RELATED READING
Continue with guides selected for overlapping concepts and practical context.