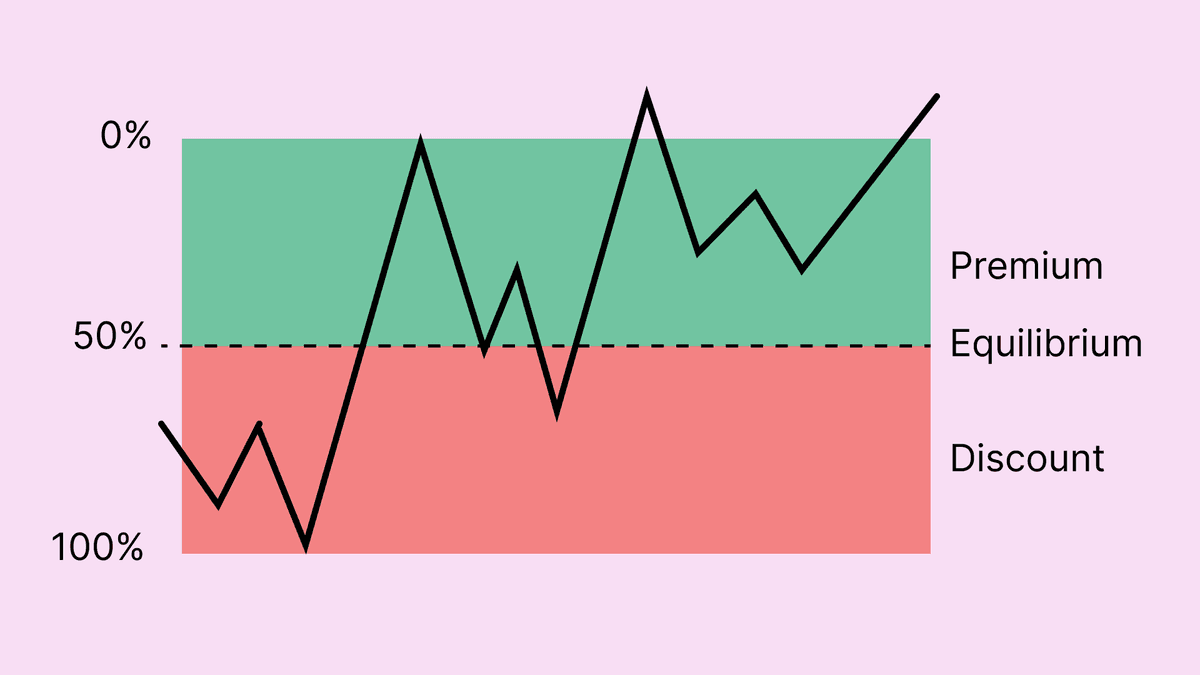
ICT Premium and Discount Zones: Midpoint Context and Limitations
Learn how ICT traders divide a selected range at its midpoint and use premium or discount as context. These labels do not prove value or predict a reversal without separately defined rules and testing.
Framework note: ICT terms are interpretations of price action, not proof of institutional motives or a market algorithm’s intent. No setup is guaranteed. Test clearly defined rules, account for costs and slippage, and use risk limits before risking capital. Read our editorial policy.
The Premium and Discount framework divides a selected dealing range around its midpoint. ICT traders may use the upper and lower halves as context, but the labels do not establish that price is objectively cheap or expensive or that it must reverse.
The Equilibrium Level — Where Premium Meets Discount
The framework divides a selected dealing range at its arithmetic midpoint (50%). Premium and discount are labels relative to that range, not objective measures of value and not evidence that sellers or buyers must become active.
This framework is applied to every dealing range you identify — the range between a significant swing high and swing low. Within any uptrend, you look for long entries when price retraces into the Discount zone below the 50% level, ideally into an OB or FVG within that discount zone. Within any downtrend, you look for short entries when price rallies into the Premium zone above the 50% level, into an OB or FVG within premium.
Optimal Trade Entry (OTE) — The 62–79% Zone
Some ICT traders study the 62–79% retracement region as an OTE zone. The ratio is a chosen chart reference; it does not show where institutions re-enter and does not provide an entry by itself.
The OTE concept is that the deepest retracement into discount that still represents a genuine correction — rather than a trend reversal — typically occurs between 62% and 79%. Retracements shallower than this may not offer enough discount to attract institutional buying. Retracements deeper than 79% begin to suggest the trend may be failing rather than correcting.
- 0% — The swing low (for bullish range) or swing high (for bearish range) — the extreme of the range
- 50% — Equilibrium — the boundary between Premium and Discount
- 62% — Start of the Optimal Trade Entry zone — deep discount begins
- 70.5% — The most common specific OTE level within the zone
- 79% — End of the Optimal Trade Entry zone — deepest acceptable retracement
- 100% — Complete retracement — if price reaches here, the previous move may be invalidated
PD Arrays and Premium/Discount Interaction
Premium and Discount zones are often studied when combined with PD Arrays — the institutional zones within those levels. An Order Block located in the Discount zone of a bullish dealing range carries significantly higher probability than an Order Block located in the Premium zone. The discount location confirms that price has retraced to an area where institutional buyers would find attractive prices.
A Fair Value Gap that overlaps a selected retracement area can be recorded as a confluence candidate. The overlap is a rule to test, not proof of an A+ setup; compare all qualifying cases, invalidations, non-touches and results after costs.
Applying Premium/Discount on Multiple Timeframes
Like all ICT concepts, Premium and Discount is fractal — it applies on every timeframe. A monthly dealing range defines premium and discount for the macro trend. A weekly dealing range defines it for the intermediate trend. A daily range for the daily bias. A 4-hour range for the session narrative. A 1-hour range for the entry setup.
Some traders look for agreement across multiple timeframes, including Premium/Discount locations. If monthly, weekly, AND daily all show price in Discount with bullish structure, and your 1-hour entry is in the OTE zone within a bullish FVG, you have alignment on four timeframes — the type of confluence that produces the cleanest, commonly discussed trades.
Common mistake: drawing the Fibonacci from the nearest visible swing. The correct approach is to draw from the most recently BROKEN swing — the swing that was taken out by a BOS or ChoCH. That displacement defines the dealing range for the retracement you are measuring.
Worked hypothetical example: set a dealing range
Assume a predefined range spans 200 to 220. Its midpoint is 210. A trader labels prices above 210 as premium and below 210 as discount, then separately requires a structure trigger and fixed invalidation before considering any trade. Price reaching 205 does not itself mean a long entry is justified; the midpoint is a location label within this framework, not a signal that reveals institutional pricing.
Failure case and what to test
The range anchors can be subjective, and price can continue moving deeper into a zone or invalidate the original range. Compare a predeclared anchor rule with a simple midpoint or trend-following baseline. Avoid moving the range endpoints to make a past entry appear optimal.
Test checklist
- Define which swing anchors create the dealing range.
- Calculate the midpoint consistently and freeze anchors before the setup.
- Require a separate entry, stop and target rule.
- Report results by trend/range context and include rejected setups and costs.
RELATED READING
Continue with guides selected for overlapping concepts and practical context.