ICT Power of Three (AMD) — Accumulation, Manipulation, Distribution Explained
The Power of Three is the three-act structure behind every candle, every session, and every weekly cycle. Once you see AMD in the market, you cannot unsee it — and it changes how you trade forever.
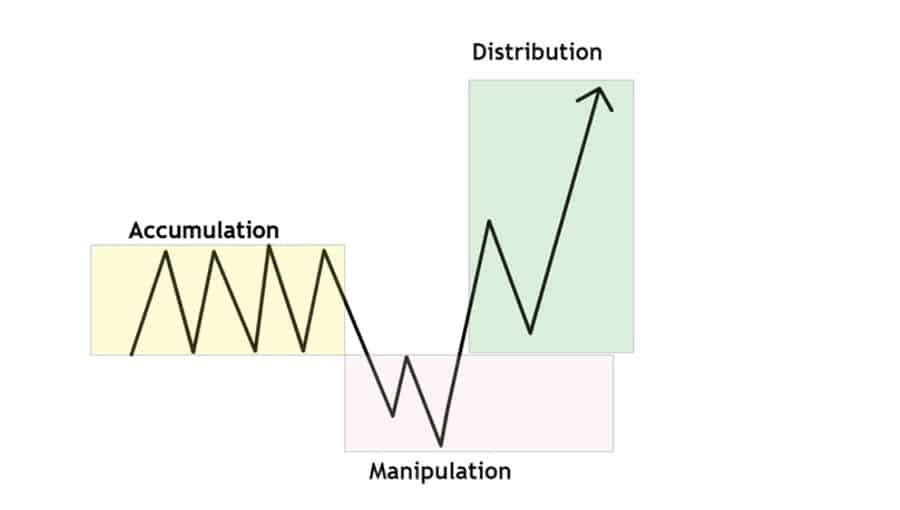
The ICT Power of Three — also called the AMD Model (Accumulation, Manipulation, Distribution) — is the foundational template that describes how smart money orchestrates price movement on every timeframe. Every daily candle follows it. Every weekly candle follows it. Every session follows it. Understanding AMD is understanding that price does not move randomly — it follows a three-act script that, once recognized, makes the apparent chaos of market price action logical and predictable.
The Three Acts of AMD
Act One — Accumulation: Smart money silently builds its position during low-volatility consolidation. Price moves sideways or ranges tightly. Volume is low. Retail traders see this as directionless chop and often disengage. But institutions are quietly accumulating their full position size at these low-volatility prices. The tighter the accumulation, the more aggressive the subsequent move.
Act Two — Manipulation: Having accumulated their position, institutions now engineer a false move in the opposite direction to the eventual true move. This manipulation serves two purposes: it triggers the stop losses of traders positioned correctly (providing liquidity for the institutional exit from the manipulative positions) and it lures new retail traders into the wrong direction just before the real move. The Judas Swing — the false move that traps retail traders — is the manipulation phase.
Act Three — Distribution: The true directional move. Price delivers rapidly and decisively to the institutional target, distributing the accumulated position at the highest possible prices (for a bullish AMD) or the lowest possible prices (for a bearish AMD). Retail traders who are now wrong-footed from the manipulation either chase the move too late or sit on the sidelines having been stopped out in Act Two.
AMD on the Daily Chart
On the daily chart, the AMD template plays out across the five trading days of the week. The accumulation typically occurs during the Asian session on Sunday night and Monday. The manipulation — the Judas Swing — typically occurs on Monday and into Tuesday, creating the week's false move. The distribution is the true weekly direction, which typically delivers from Tuesday through Thursday.
The classic ICT weekly template: if the true weekly direction is bullish, Monday will often open and first move lower (sweeping weekly sell-side liquidity — the Judas Swing), creating a lower-low that traps sellers and stops out early long traders. Then, from Tuesday, price reverses and delivers higher through the rest of the week, distributing to the weekly target.
AMD on the Intraday Chart
On the 5-minute or 15-minute chart, the AMD template plays out within each session. The London session often provides the manipulation (the Judas Swing), sweeping the Asian range extreme before reversing. The New York session then provides the distribution — the true daily directional move that targets the daily liquidity pool.
- diamondAsian Session = Accumulation: Range-bound, low volatility, tight consolidation. Do not trade during this period — you are watching accumulation happen.
- diamondLondon Open = Manipulation: The Judas Swing sweeps a liquidity level in the wrong direction. This is where retail traders get trapped.
- diamondNew York Session = Distribution: The real move. Enter after the Judas Swing has been confirmed reversed, in the direction of the true daily bias.
Identifying the Judas Swing
The Judas Swing is the manipulation component of AMD — the false breakout that precedes the true move. Identifying it is the key practical skill of AMD trading. A Judas Swing is characterized by a sharp, fast move in one direction that takes out a swing high or low (collecting the liquidity), followed by an equally sharp reversal. It often occurs during the first 30-60 minutes of the London session.
After the Judas Swing reversal, look for the first displacement move in the true direction. This displacement will leave a Fair Value Gap — your entry on the retracement. The complete AMD trade entry: wait for the Judas Swing, confirm the reversal with a displacement + FVG in the true direction, enter at the FVG CE, target the daily liquidity pool.
To internalize AMD, study 50 consecutive daily charts on any instrument. Mark the accumulation zone, identify the Judas Swing (the false move), and note where the distribution delivered to. You will find that 60-70% of days follow the AMD template clearly. The 30-40% that do not are typically days with major economic news releases that override the typical algorithmic delivery.