ICT Optimal Trade Entry (OTE): Retracement Zones and Testing
A guide to the commonly discussed OTE retracement area, how to state swing anchors consistently, and why a Fibonacci zone is context rather than a standalone entry signal.
Framework note: ICT terms are interpretations of price action, not proof of institutional motives or a market algorithm’s intent. No setup is guaranteed. Test clearly defined rules, account for costs and slippage, and use risk limits before risking capital. Read our editorial policy.
The Optimal Trade Entry (OTE) is ICT's framework for using Fibonacci retracement to identify the precise zone where institutional traders re-enter the market after a displacement move. It is not a generic Fibonacci tool — it uses specific levels (62%, 70.5%, and 79%) that represent the discount zone within any completed swing, and it is only valid when applied to a genuine ICT swing that shows institutional participation.
The OTE Fibonacci Levels
The OTE framework uses three specific Fibonacci levels: 62%, 70.5%, and 79%. These three levels define the OTE zone — the discount area of any swing where institutions re-enter. The 70.5% level is the most precise entry point within the OTE, representing the deepest point of fair value within the zone. The 62% level marks the beginning of the OTE, and the 79% level marks the outer boundary beyond which the swing may be invalid.
To draw the OTE, you swing from a significant low to a significant high (for a bullish OTE) or from a significant high to a significant low (for a bearish OTE). The retracement into the 62-79% zone is your OTE. When price enters this zone, you are looking for confirmation to enter in the direction of the original swing.
Why the 62-79% Zone Is Institutional
Retail traders typically enter at 38.2% or 50% retracements — the standard Fibonacci levels most trading education focuses on. Institutions do not operate at these levels. They need price to retrace deeper to build their full position size without creating too much slippage. The 62-79% zone represents where the algorithm delivers price to fill institutional orders, precisely in the discount zone of the swing, before the continuation move.
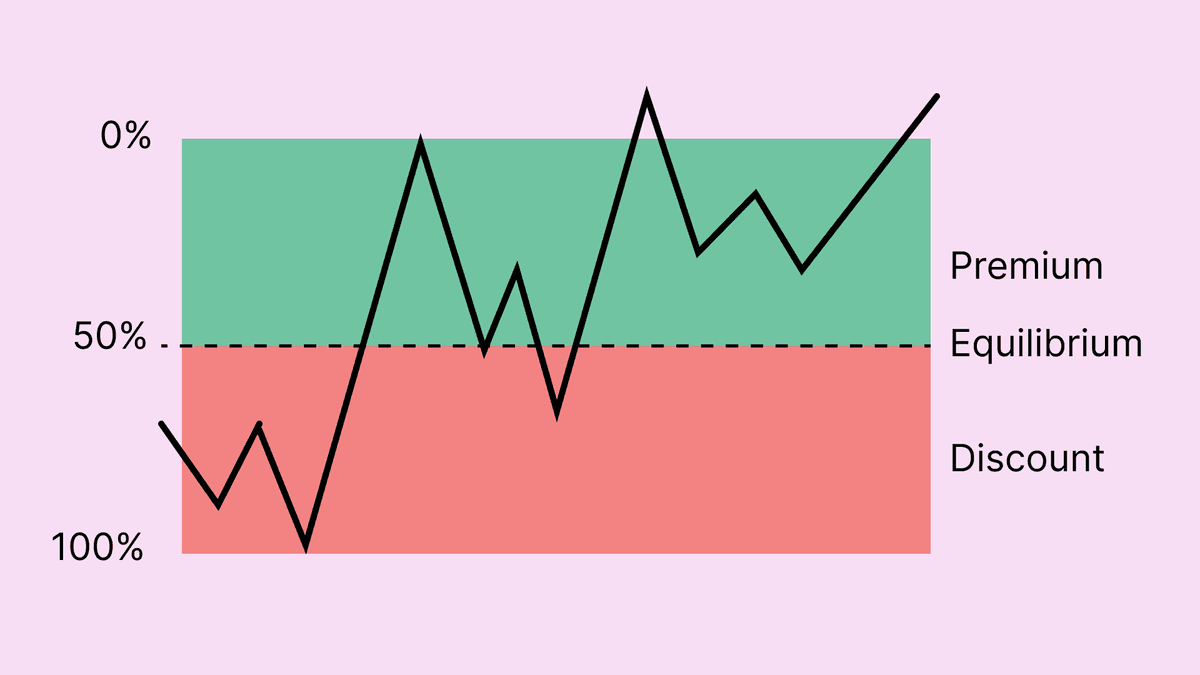
The connection to Premium and Discount is direct: 0% to 50% of any swing is premium (expensive). 50% to 100% is discount (cheap). The OTE zone at 62-79% sits firmly in the discount half — price is below equilibrium, which is exactly where institutions want to accumulate long positions (or above equilibrium for short positions).
Applying the OTE — Step by Step
- Identify a displacement swing — a sharp, impulsive move that shows genuine institutional participation (large candles, minimal overlap)
- Anchor your Fibonacci from the swing low to the swing high (for bullish OTE) — 0% at the low, 100% at the high
- Mark the OTE zone: 62% to 79% retracement levels
- Mark the 70.5% level specifically — this is your primary entry target
- When price retraces into the OTE zone, switch to a lower timeframe (5-minute or 1-minute) and look for a bullish displacement or FVG as confirmation
- Enter at the 70.5% level or at the CE of the first bullish FVG that forms within the OTE zone
- Stop loss: below the 100% level (the swing low) — if price takes out the entire swing, the OTE is invalid
- Target: the high of the swing (100% extension) or the next liquidity pool beyond the swing high
OTE Within the PD Array Context
Some traders study an OTE when the 62%–79% zone also aligns with an Order Block, Fair Value Gap or Breaker Block. This overlap defines a testable confluence rule, but it does not establish a higher win rate without recorded results.
On the daily timeframe, an OTE into a 4-hour Order Block at the 70.5% level during the London Killzone is an example of maximal confluence. The HTF structure is aligned, the PD Array element provides the entry zone, the Fibonacci level confirms the discount pricing, and the session timing confirms the algorithmic delivery window.
The OTE is a filter, not a standalone setup. Price must reach the 62-79% zone — you do not enter at 38% because it looks like a good level. You wait for the discount. The discipline to wait for price to come to you, rather than chasing it at shallow retracements, is what separates OTE traders who profit from those who do not.
Worked hypothetical example
A trader measures a hypothetical impulse from 100 to 110 and has chosen the 62–79% retracement band for a study. Under that convention the candidate area is approximately 102.1 to 103.8. Price trades into the band, but the trader’s separate confirmation does not appear before the setup expires, so no trade is recorded.
Failure case and what to test
Moving the swing anchors after price returns or selecting only levels that held creates hindsight bias. Retracement ratios are mathematical references; they do not establish where institutions will re-enter or whether a trade has positive expectancy.
Test checklist
- Set the swing-anchor rule and ratios before the sample.
- Record touches that hold, fail, and never reach the zone.
- Compare with simpler retracement rules after spread, slippage and fees.
RELATED READING
Continue with guides selected for overlapping concepts and practical context.