ICT Market Structure — The Foundation Every Trader Must Master
Market Structure is the foundation of all ICT analysis. Without understanding how price creates trends, breaks structure, and signals reversals, every other concept falls apart. This is the most important guide on the platform.
Market structure is the architecture of price — the sequential arrangement of highs and lows that defines trend direction, identifies when trends are changing, and reveals the most important price levels in any market. Without a mastery of structure, every other ICT concept loses its context. You cannot identify the Draw on Liquidity without knowing structure. You cannot validate an Order Block without confirming a Break of Structure. Structure is where everything begins.
The Building Blocks: Highs and Lows
Every price movement creates swing highs and swing lows. A swing high is a price peak where price moved up, paused or consolidated, then moved lower — a local maximum in price. A swing low is a price trough where price moved down, paused, then moved higher. The sequence and relationship between these highs and lows tells you everything you need to know about trend direction and strength.
ICT distinguishes between three tiers of structural significance: Short-Term Highs and Lows (STH/STL) — the smallest swing points visible on your working timeframe; Intermediate-Term Highs and Lows (ITH/ITL) — more significant swings that require multiple STH/STL to form; and Long-Term Highs and Lows (LTH/LTL) — the major structural points visible on higher timeframes that define the macro trend.
Bullish Market Structure: The Uptrend Sequence
A bullish market structure is characterized by a sequence of Higher Highs (HH) and Higher Lows (HL). Each rally creates a new high above the previous rally high — a Higher High confirming upward momentum. Each retracement creates a low above the previous retracement low — a Higher Low confirming that buyers are stepping in at progressively higher prices.
This sequence does not need to be perfect. Brief violations and complex corrections are normal within an uptrend. What matters is the overall pattern — are the significant highs and lows generally trending higher? ICT traders always identify this sequence from the highest timeframe they are analyzing before drilling down to lower timeframes for entry.
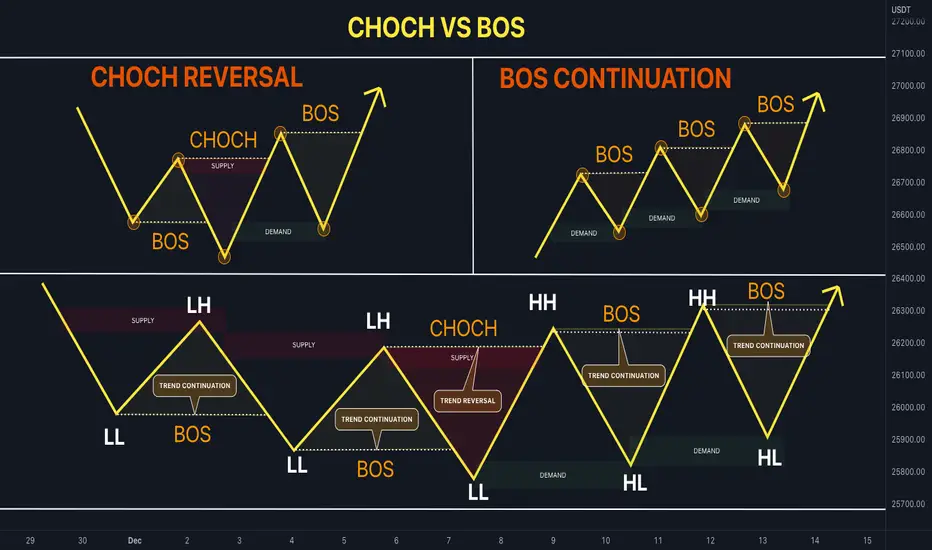
Break of Structure (BOS) vs Change of Character (ChoCH)
The Break of Structure (BOS) occurs when price takes out a previous swing point in the same direction as the existing trend. In a bullish trend, price makes a Higher High — breaking above the most recent significant high. This is a BOS that confirms the trend is continuing. It is a signal to look for long entries on the next retracement, not a reversal signal.
The Change of Character (ChoCH) — also called Market Structure Shift (MSS) — occurs when price takes out a swing point in the OPPOSITE direction of the existing trend. In a bullish trend, if price breaks below a significant Higher Low, that is a ChoCH — the first warning that the bullish structure may be ending. Unlike a BOS, a ChoCH signals a potential reversal and causes ICT traders to pause their bullish bias and watch for confirmation of the new bearish direction.
- diamondBOS in an uptrend = price breaks above a previous swing high = trend continuation signal = look for longs on the next pullback
- diamondBOS in a downtrend = price breaks below a previous swing low = trend continuation signal = look for shorts on the next rally
- diamondChoCH from uptrend = price breaks below a previous Higher Low = first reversal warning = pause bullish bias, wait for bearish confirmation
- diamondChoCH from downtrend = price breaks above a previous Lower High = first reversal warning = pause bearish bias, wait for bullish confirmation
- diamondThe displacement that creates a ChoCH must be significant — a weak, hesitant break is not a true ChoCH
Internal vs External Structure
One of the most nuanced aspects of ICT market structure is the distinction between internal and external structure. External structure refers to the major swing highs and lows that define the primary trend — these are the points that, when broken, create a genuine trend change. Internal structure refers to the smaller highs and lows that form within the overall trend — corrections and sub-waves within the larger move.
Many traders make the mistake of treating every BOS equally. When a small internal high is broken during a normal correction in a downtrend, that is an internal BOS — it does not signal a trend reversal. Only when a major external structural high is taken out does a genuine trend reversal occur. Misidentifying internal vs external structure causes traders to constantly flip bias and miss the larger trend.
Weekly Market Rhythm — Structure on the Calendar
ICT market structure does not exist only on price charts — it follows a weekly calendar rhythm. Monday typically establishes the week's initial direction through the first significant move, often creating the low or high that will define the week's range. Tuesday and Wednesday frequently see the primary trend move develop. Thursday can see continuation or early reversal signs. Friday is often used for position squaring and range compression before the weekend.
Understanding this weekly rhythm allows ICT traders to have expectations about which days are most likely to produce tradeable setups and which days may deliver countertrend moves designed to shake out positions. The classic ICT weekly pattern is a Monday liquidity sweep of the previous week's range, followed by a directional delivery that completes by Thursday or Friday.
The most common structural analysis mistake: calling every BOS a reversal signal. A BOS confirms the trend — it is a continuation signal. Only a ChoCH signals a potential reversal, and even then, it requires displacement and additional confirmation before you flip your bias.