ICT Market Order Flow: Observable Data vs Chart Interpretation
Distinguish market-microstructure order flow from ICT interpretations of candle structure. Chart patterns alone do not reveal the complete order book, participant identities or institutional intent.
Framework note: ICT terms are interpretations of price action, not proof of institutional motives or a market algorithm’s intent. No setup is guaranteed. Test clearly defined rules, account for costs and slippage, and use risk limits before risking capital. Read our editorial policy.
In market microstructure, order flow refers to submitted, cancelled or executed orders and their effects on liquidity and price. In ICT education, the phrase is also used as an interpretation of price structure; candles alone cannot quantify the aggregate position or directional intent of banks, funds or algorithms.
What Is Institutional Order Flow?
Order flow, in the broadest sense, is the net imbalance between buyers and sellers. When buyers are more aggressive than sellers, order flow is bullish — price moves up. When sellers dominate, order flow is bearish — price moves down. Institutional order flow specifically refers to the directional pressure from large institutions whose order sizes are large enough to move markets.
A candle chart is a limited view of market activity. It does not expose the full order book, participant identities or all execution venues, and chart patterns should not be described as a verified institutional footprint without supporting order-level data.
Reading Order Flow — The Structural Method
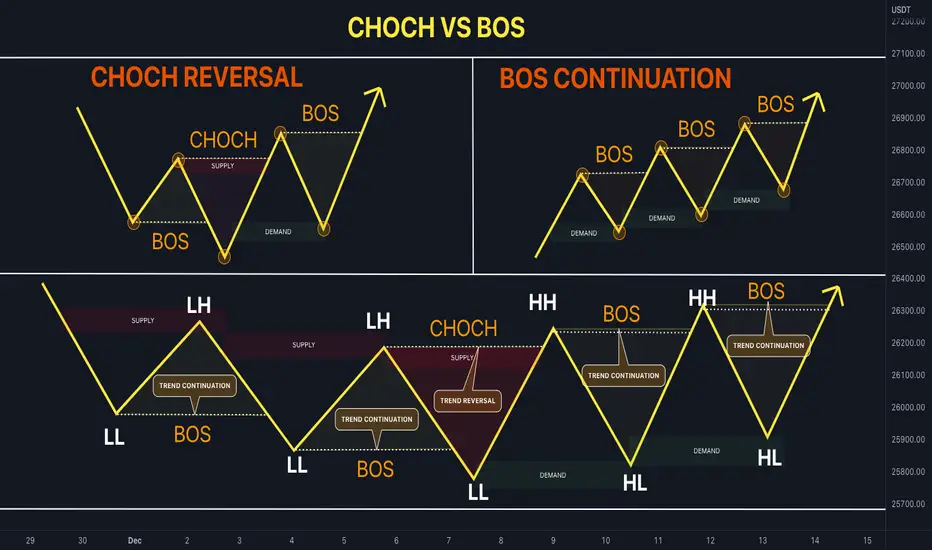
Some ICT traders infer directional context from swing structure and displacement. Those are chart-based proxies rather than a direct measurement of institutional order flow; define the rule and test whether it adds value compared with a simpler structural baseline.
Changes in order flow are signaled by the structural shift concepts: ChoCH (first deviation), MSS (confirmed shift), and CISD (real-time transition). Each of these events represents a moment when the dominant institutional direction has changed — when the buyers have become sellers, or the sellers have become buyers, at the institutional level.
Confirming Order Flow With Multiple Timeframes
- Daily order flow: determined by the weekly chart structure. If the weekly chart shows bullish structure (HH/HL), the daily order flow is bullish — all daily entries should be long.
- Intraday order flow: determined by the daily chart structure. If the daily chart is bullish (HH/HL), intraday order flow is bullish — all 15-minute and 5-minute entries should be long.
- Entry-timeframe order flow: confirmed by the 5-minute or 1-minute MSS in the direction of the HTF bias. The LTF MSS is the real-time confirmation that institutional orders are executing at the entry zone.
- Conflicting order flow (e.g., bullish weekly but bearish daily) indicates consolidation or transition. Reduce position sizing and wait for clarity before committing to a direction.
Order Flow and Stop Placement
Understanding order flow also determines stop loss placement. Your stop is placed at the level that, if reached, would invalidate the order flow bias. For a bullish daily order flow trade, the stop goes below the last significant daily Higher Low — if that level is broken, the bullish order flow has been negated and the trade premise is invalid. This principle prevents the common mistake of placing arbitrary stops based on risk amount rather than structural logic.
Every morning before trading, take 5 minutes to verbally state the order flow on three timeframes: "Weekly order flow is [direction] because [structural reason]. Daily order flow is [direction] because [structural reason]. 4-hour order flow is [direction] because [structural reason]." If all three align, you have maximum confluence for your trading bias. If they conflict, wait for resolution before trading.
Worked hypothetical example
Price repeatedly makes higher swing highs and higher lows while pullbacks remain shallow over the selected sample. A trader labels the sequence bullish under a written structure rule and notes the last confirmed higher low as a reference. When price later breaks below it, the trader updates the chart description without claiming to know which participants caused the move.
Failure case and what to test
Candlestick and swing patterns do not provide a complete view of order flow across venues. News, liquidity, execution and timeframe selection can affect what appears directional, and a readable structure can still be unprofitable to trade.
Test checklist
- State the observable rule behind each order-flow label.
- Test across instruments and market regimes instead of one chart.
- Separate description of price from claims about institutional intent.
RELATED READING
Continue with guides selected for overlapping concepts and practical context.