ICT Liquidity Sweep vs Liquidity Run — The Critical Difference
Distinguish a brief move beyond a reference level from sustained movement through it using observable rules; neither a sweep label nor a run label alone guarantees reversal or continuation.
Framework note: ICT terms are interpretations of price action, not proof of institutional motives or a market algorithm’s intent. No setup is guaranteed. Test clearly defined rules, account for costs and slippage, and use risk limits before risking capital. Read our editorial policy.
The distinction between a Liquidity Sweep and a Liquidity Run is one of the most practical and important in all of ICT methodology — because the two patterns look nearly identical on a chart, yet one signals a reversal and the other signals continuation. Getting this distinction right separates profitable ICT traders from those who consistently enter reversals when they should be entering continuations, and vice versa.
What Is a Liquidity Sweep?
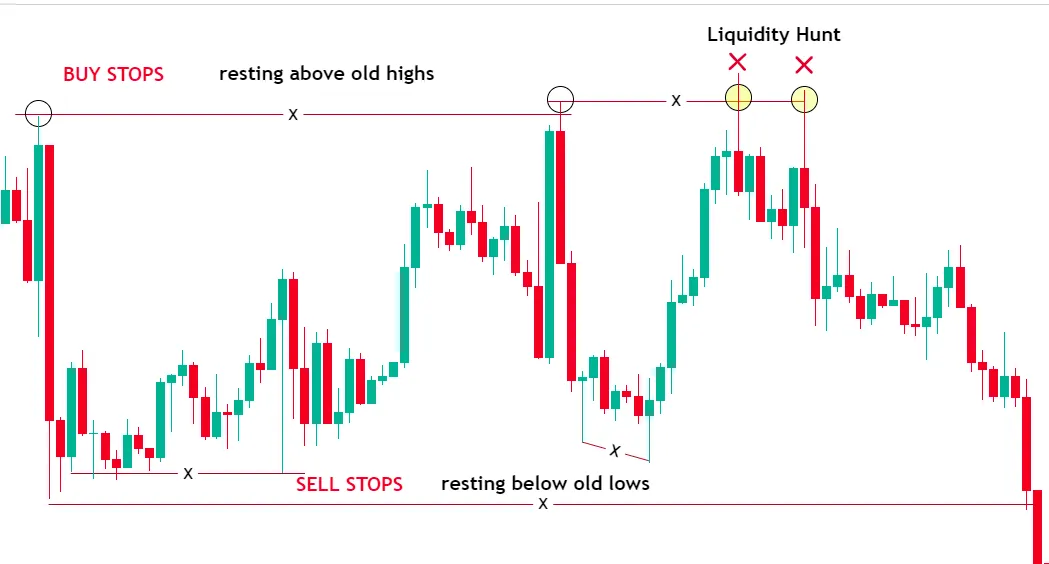
A Liquidity Sweep (also called a Stop Hunt or False Breakout) occurs when price briefly moves beyond a swing high or swing low — triggering the stop orders resting there — and then immediately and sharply reverses back in the opposite direction. The sweep collects the liquidity, completes its objective, and the delivery direction reverses.
The key characteristic of a sweep is the immediate reversal. Price goes beyond the level, then comes right back. On a candle chart, this often appears as a long wick that extends beyond the swing level and then closes back inside the range. The sweep is complete; it was manipulation. The reversal from the sweep is the trade opportunity — Turtle Soup, Venom Model, Silver Bullet setups all capitalize on sweeps.
What Is a Liquidity Run?
A Liquidity Run occurs when price moves through a swing high or swing low and continues in the same direction — not reversing but accelerating. The level was not a reversal point; it was a staging post. Price ran through the liquidity (collected the stops) and is now using that liquidity as fuel to continue delivering in the same direction toward the next, larger liquidity pool.
Liquidity Runs appear when the immediate liquidity pool was not the final destination — the algorithm needed those orders to fill its position before continuing to the larger ERL target beyond. The run through the first level is the LRLR (Low Resistance Liquidity Run) delivering to the next major pool.
How to Tell the Difference — In Real Time
- Candle close matters: a sweep typically produces a candle that closes BACK inside the prior range. A run produces a candle that closes BEYOND the prior range with conviction.
- Speed of reversal: a sweep reversal is immediate — within 1-3 candles of the sweep on the entry timeframe. A run shows no reversal and instead builds another base beyond the swept level.
- HTF context: is the swept level the final liquidity pool in the current range, or is there a larger pool beyond it? If there is a bigger pool beyond, it is more likely a run through the first level toward the bigger target.
- Volume and displacement: a run through a level often shows larger, more committed displacement candles than a sweep. A sweep often produces a spike wick with minimal body.
- PD Array presence: a sweep reverses from a PD Array on the other side of the sweep level. If there is no significant PD Array beyond the sweep level, it may be a run.
Why the Confusion Costs Traders Money
The most damaging scenario: a trader sees price break above a swing high. They interpret it as a sweep (manipulation before reversal). They go short. But it was actually a liquidity run — and price continues aggressively higher, stopping them out. The mistake was not recognizing that the swing high was an internal liquidity level with a larger BSL target beyond it, making a run more likely than a sweep.
Before assuming any move through a swing level is a sweep, ask: what is beyond this level? If the next significant liquidity pool is further in the same direction, price may be running toward it. Only fade the break (treat it as a sweep) if: (1) the level is the final ERL in the current range with no larger target beyond it, and (2) the HTF context suggests reversal from this general area is due.
Worked hypothetical example
A trader marks a prior swing high. In one case, price trades above it but closes back below under the trader’s chosen rule; in another, multiple closes hold above the level and price continues making highs. The cases are classified separately, while later outcomes are recorded rather than inferred from the initial label.
Failure case and what to test
Wick-only and close-based definitions can give different labels, especially during fast markets or around news. A move that first looks like a sweep can later continue, so the label needs a fixed observation point.
Test checklist
- Choose the level and the wick/close rule before watching the outcome.
- Set a consistent time or candle count for classifying continuation.
- Log later reversal and continuation outcomes separately from the initial label.
RELATED READING
Continue with guides selected for overlapping concepts and practical context.