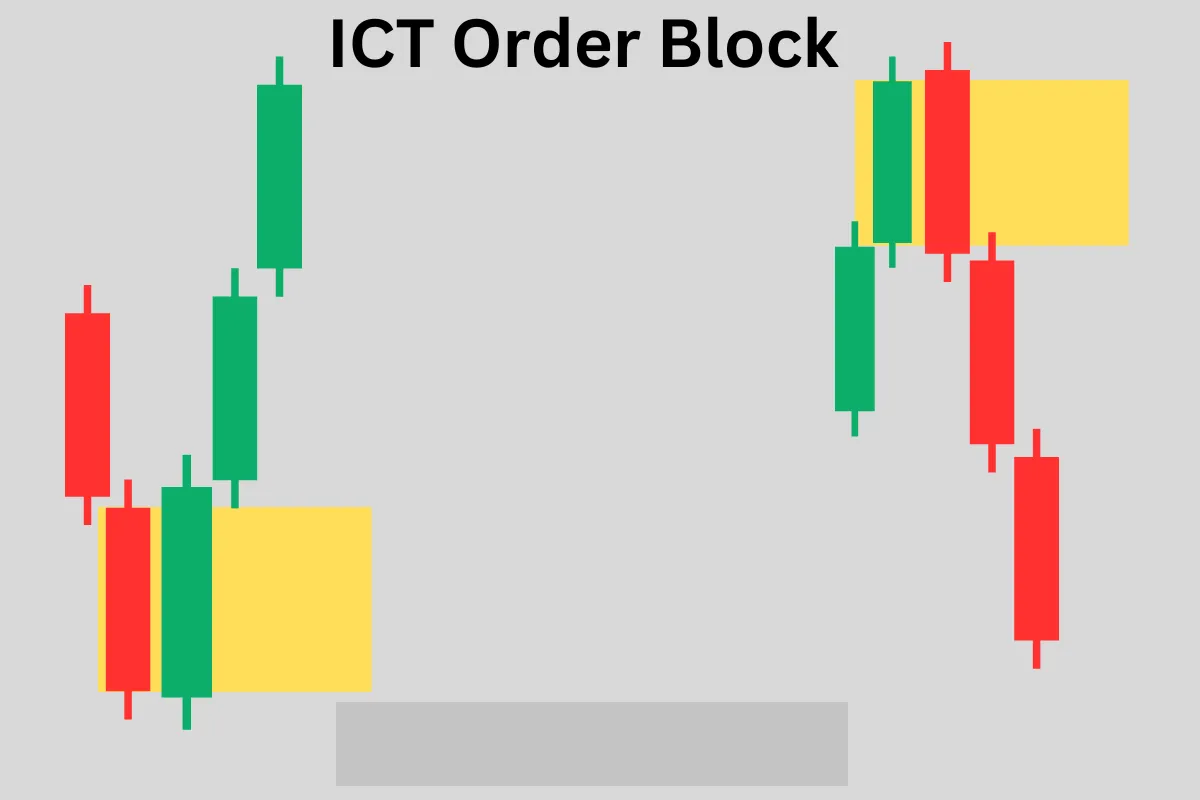
ICT Hidden Order Block: Definitions and Chart Examples
Review the Hidden Order Block label as used in ICT education, how traders mark candidate zones, and what evidence would be needed to evaluate the idea. Terminology alone is not a trading signal.
Framework note: ICT terms are interpretations of price action, not proof of institutional motives or a market algorithm’s intent. No setup is guaranteed. Test clearly defined rules, account for costs and slippage, and use risk limits before risking capital. Read our editorial policy.
The ICT Hidden Order Block is a PD Array concept that most ICT traders miss because it is literally invisible on the timeframe they are analyzing — it can only be seen by drilling down to a lower timeframe. The Hidden OB is derived from overlapping wicks between consecutive candles, revealing institutional orders that are concealed within the wick structure of a candle that appears to be simply a correction or consolidation on the higher timeframe.
What Makes an Order Block Hidden?
A standard Order Block is visible on the timeframe you are analyzing — you can clearly see the last opposing candle before a major move. The Hidden OB is hidden because, on the higher timeframe, it appears to be a simple wick or a minor retracement. Only when you zoom into the lower timeframe does the actual Order Block structure become visible within those wicks.
The mechanism: on a higher timeframe (say 1-hour), a candle may have a long lower wick that appears to simply represent a test and rejection of a level. But zoom into the 5-minute chart and you will find that within that wick, there was a specific last-bullish-before-bearish or last-bearish-before-bullish candle — a complete Order Block formation that is invisible at the higher timeframe.
Finding Hidden Order Blocks — The Technique
- Identify a candle on your working timeframe (15-min or 1-hour) that has a significant wick — either the upper or lower wick extends notably beyond the body.
- Zoom into the lower timeframe (5-minute or 1-minute) and navigate to the period that corresponds to the wick of the higher timeframe candle.
- Within that wick period on the lower timeframe, identify the last opposing candle before the wick's reversal move — this is the Hidden Order Block.
- Mark the high and low of that specific candle on the lower timeframe. This zone, while invisible on the 15-min chart, is a fully valid ICT Order Block.
- When price returns to that zone, it should react as a standard OB would — providing the entry for a trade in the direction of the wick rejection.
Why Hidden OBs Are Powerful
Hidden Order Blocks are powerful precisely because most traders do not see them. When price returns to the level of a higher timeframe wick, the majority of traders expect a simple test of a minor level — they are not prepared for the sharp reaction that the Hidden OB produces. The institutional orders sitting at the Hidden OB level trigger, price reacts sharply, and traders who did not identify the Hidden OB are caught off-guard.
This element of surprise is what makes Hidden OBs among the commonly studied PD Array elements for entries. The lack of retail awareness means fewer competing orders at the level, which means institutional orders dominate the reaction — producing cleaner, faster moves than standard OBs that everyone has marked on their charts.
Overlapping Wicks — The Hidden OB Cluster
When multiple consecutive candles have overlapping wicks at the same price level — their wicks touch or overlap without the bodies trading through — this creates what ICT calls a Hidden OB cluster. This is essentially multiple Hidden Order Blocks stacked at the same level, each one adding to the institutional significance of the zone. These clusters are among the confluence-based PD Array elements in the advanced ICT toolkit.
Make Hidden OB hunting a regular practice by reviewing your higher timeframe analysis at the lower timeframe before each session. Specifically, look at all significant wick rejections on the daily or 4-hour chart and drill into them on the 15-minute chart. The Hidden OBs you find there will often be the commonly discussed entry zones of the upcoming session.
Worked hypothetical example
Suppose a trader sees an area that appears more clearly on a 5-minute chart than on a 1-hour chart and labels it a candidate Hidden Order Block using a definition from their chosen source. Before price returns, the trader records the precise candle boundaries and the confirmation they would require. On a later revisit, price trades through the area without reacting; that outcome stays in the sample.
Failure case and what to test
The label can become a hindsight explanation when the zone is drawn only after price reacts. Different educators may define the pattern differently, and a visually neat zone does not prove that hidden orders are waiting there.
Test checklist
- Record the exact definition and candle boundaries before the retest.
- Test reactions, clean passes and ambiguous examples with the same rule.
- Compare results with an ordinary swing or support/resistance reference.
RELATED READING
Continue with guides selected for overlapping concepts and practical context.