ICT Daily Bias: A Pre-Session Thesis and Invalidation Rules
A practical process for forming a conditional daily thesis from higher-timeframe structure and prior ranges, with explicit invalidation criteria instead of claims that a correct bias can be known in advance.
Framework note: ICT terms are interpretations of price action, not proof of institutional motives or a market algorithm’s intent. No setup is guaranteed. Test clearly defined rules, account for costs and slippage, and use risk limits before risking capital. Read our editorial policy.
A daily bias is a directional thesis a trader forms from selected higher-timeframe structure and reference levels. Being wrong about that thesis does not make every technically defined entry fail, and being right does not establish that an algorithm or target was known in advance.
The Core Question: Where Is Price Going?
Some ICT traders use a Draw on Liquidity (DOL) as a candidate target based on prior highs, lows or range boundaries. The chart does not reveal an algorithm's destination; define what would invalidate the thesis and allow for days when neither side is reached.
In this framework, a Draw on Liquidity (DOL) is commonly identified as a possible liquidity target. Specifically: Equal Highs or Equal Lows, Previous Day High or Low, Previous Week High or Low, a major swing high or swing low on the daily chart, an open FVG or NWOG that represents an imbalance to be filled. Before you can determine daily bias, you must identify which of these liquidity pools is closest and most likely to be reached given the current structural context.
The ICT Daily Bias Framework
- Step 1 — Weekly Analysis: Determine the weekly bias first. Is the weekly chart making Higher Highs and Higher Lows (bullish)? Or Lower Highs and Lower Lows (bearish)? The weekly structure is the primary filter.
- Step 2 — Mark the Weekly DOL: Where is price likely delivering to by Friday? The previous week's high (BSL) or the previous week's low (SSL)? This is your weekly target.
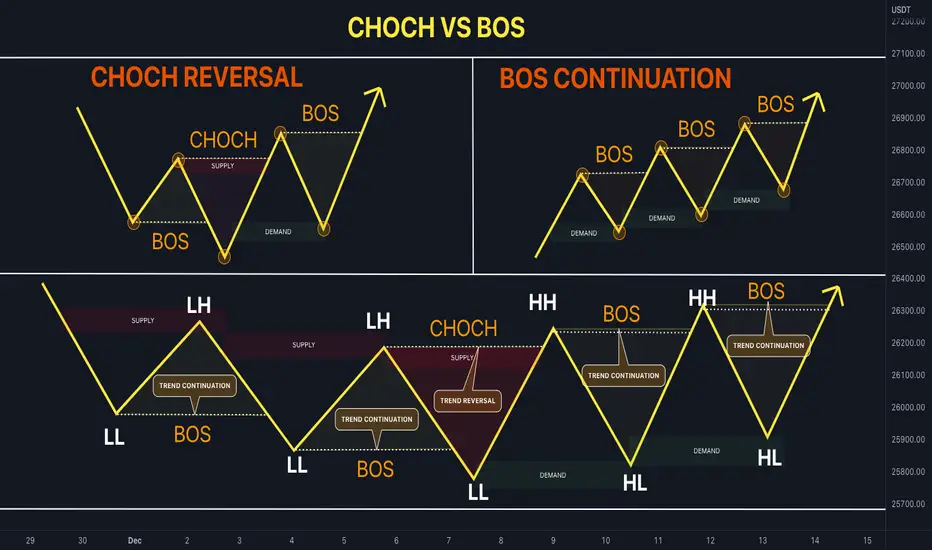
- Step 3 — Daily Structure: On the daily chart, identify the most recent swing structure. Is the last daily candle sequence making Higher Lows (bullish) or Lower Highs (bearish)? Has there been a recent BOS or ChoCH on the daily?
- Step 4 — Mark Daily PD Arrays: Identify any open daily FVGs, recent daily OBs, and the previous day's high and low. These are the levels that price is most likely delivering to or from today.
- Step 5 — The London Open Context: Before London opens, note whether the overnight price action swept any Asian range extreme. If the Asian low was swept overnight, the bias for London is likely bullish. If the Asian high was swept, bias is likely bearish.
- Step 6 — State your bias explicitly: "Today's bias is bullish. I expect price to deliver toward [specific level] during the New York session." Writing it down forces clarity.
The Previous Day's High and Low — The Most Useful Daily Bias Anchor
Previous-day highs and lows are common chart references. A bullish thesis does not mean price is expected to reach the PDH in the current session, nor does a bearish thesis require the PDL to be reached; track all outcomes before claiming value from the filter.
When price opens the London or New York session below the PDH in a bullish context, the PDH is your primary target. When price is above the PDL in a bearish context, the PDL is your target. This gives you an immediately visible, quantifiable target before the session begins — and allows you to define your trade structure (entry at PD Array, stop below the entry zone, target at the PDH or PDL) before a single candle of the session has formed.
When Daily Bias Is Unclear
On some days, the daily bias is genuinely unclear — the weekly structure is consolidating, the daily chart shows balanced structure, and there are no obvious draws on liquidity in either direction. On these days, the correct approach is to wait. Do not force a bias onto a market that is in genuine equilibrium. The algorithm is accumulating during these periods, and attempting to trade in a direction during genuine consolidation will result in getting chopped up in both directions.
The most important bias-determination discipline: state your bias BEFORE the session opens and do not change it once the session begins unless a clearly significant structural event invalidates it. Traders who switch their bias based on the first 30 minutes of price action are not trading bias — they are reacting to noise. True bias is determined in pre-session analysis, not in real-time reaction.
Worked hypothetical example
Before the session, a trader records a bullish scenario above a defined range high, a bearish scenario below the prior-day low, and a neutral condition when price stays between them. Price remains inside the range for most of the session, so the neutral scenario is accepted rather than forcing a directional trade.
Failure case and what to test
A bias can become a post-hoc story if the trader changes the relevant level after price moves. A directional forecast can also be correct but produce a losing entry, so prediction and execution results should not be combined into one score.
Test checklist
- Write bullish, bearish and neutral conditions before the session.
- State what invalidates the thesis and when to stop using it.
- Track bias accuracy separately from entry performance and costs.
RELATED READING
Continue with guides selected for overlapping concepts and practical context.