ICT CISD — Change in the State of Delivery Explained
CISD is the moment the algorithm switches from delivering price in one direction to delivering it in the opposite direction. Recognizing it early is how you get in at the very beginning of a new move.
Framework note: ICT terms are interpretations of price action, not proof of institutional motives or a market algorithm’s intent. No setup is guaranteed. Test clearly defined rules, account for costs and slippage, and use risk limits before risking capital. Read our editorial policy.
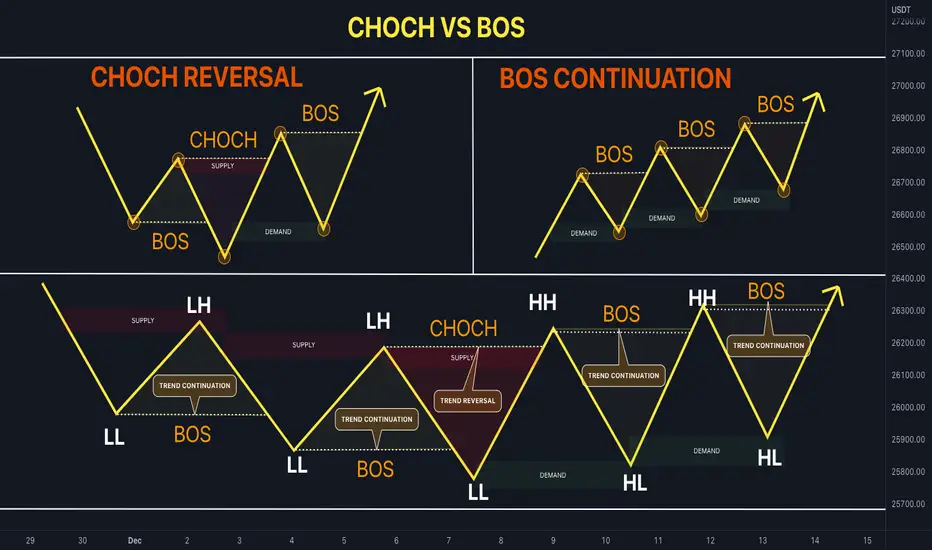
The Change in State of Delivery (CISD) is one of the most precise and powerful concepts in all of ICT methodology. It represents the exact moment when the algorithm transitions from delivering price in one direction to delivering it in the other direction. Unlike the Change of Character (ChoCH) or Break of Structure (BOS) — which identify structural shifts after they have already occurred — the CISD signals the transition at its very inception, giving traders the earliest possible warning that the delivery has changed.
CISD vs ChoCH vs BOS — The Hierarchy
Understanding how CISD relates to the other structural concepts is essential. A Break of Structure (BOS) confirms the existing trend — a higher high in an uptrend, a lower low in a downtrend. A Change of Character (ChoCH) is the first structural shift against the prevailing trend — a lower high in an uptrend, or a higher low in a downtrend. These occur after a significant number of bars.
A CISD occurs within a single candle or a very short sequence of candles — it is the real-time moment of delivery change, happening before the ChoCH or BOS has even formed. The CISD tells you the algorithm has switched gears right now. The ChoCH and BOS confirm that switch after it has already been underway for some time.
How to Identify a CISD
A bullish CISD occurs when, during a bearish delivery (price is moving down), a candle or group of candles closes above a recent short-term high — specifically the high that would have constituted the definition of bearish delivery. The state was: lower highs, lower lows. The CISD is the first candle that takes out the most recent lower high, indicating the delivery has transitioned from bearish to bullish.
A bearish CISD is the mirror: during bullish delivery (higher highs, higher lows), the first candle or group of candles that takes out the most recent higher low signals the CISD — the delivery has transitioned from bullish to bearish.
- In a bearish move, mark each short-term high as a reference point. When a candle closes above the most recent short-term high, this is the CISD — bullish delivery has begun.
- In a bullish move, mark each short-term low. When a candle closes below the most recent short-term low, this is the CISD — bearish delivery has begun.
- The CISD candle is often a displacement candle — it is large-bodied and closes decisively beyond the reference point, not just a wick penetration.
- Confirm on the timeframe appropriate to your trade — a 5-minute CISD for intraday entries, a 1-hour or 4-hour CISD for swing entries.
CISD and the Fair Value Gap
The commonly discussed application of the CISD concept is in combination with a Fair Value Gap. When a CISD occurs, it frequently creates a Fair Value Gap in the displacement move that constitutes the change. This FVG — the CISD FVG — represents the confluence-based entry zone for the new delivery direction.
When price creates a bullish CISD and leaves a bullish FVG in the displacement, that FVG is your entry on the retracement. The algorithm will often reprice into the CISD FVG before continuing the new bullish delivery. Waiting for that retracement into the CISD FVG gives you a low-risk entry at the beginning of a new directional delivery.
CISD vs MSS — The Distinction
The Market Structure Shift (MSS) and CISD are closely related but not identical. The MSS is the structural break that confirms the new direction — it is essentially the CISD confirmed by structure. In practice, many traders use the terms interchangeably, but the technical distinction is that a CISD can be identified in the moment it occurs (the displacement candle), while the MSS is confirmed only after the close of that candle or candles.
Practice identifying CISDs on a lower timeframe (1-minute or 5-minute chart) during Silver Bullet windows. The CISD within the Silver Bullet window — when the algorithm shifts from the sweep direction into the trade direction — is one of the cleanest and most precise entry signals in all of ICT methodology.
Worked hypothetical example: define a CISD label
A trader defines a bullish CISD candidate as a candle close above a specified prior bearish candle's opening price after a downward sequence. If the next candle fails to hold that level, the case is still recorded but flagged as failed follow-through. This rule creates a repeatable label without assuming an algorithm switched direction.
Failure case and what to test
CISD definitions vary, and a close across a reference level may occur during noise or continue in the prior direction. Compare close-based versus wick-based rules and define how much follow-through is needed before evaluating any trade model.
Test checklist
- Specify the reference candle and exact level being crossed.
- Define whether the condition is a wick, close or multi-candle sequence.
- Record the next fixed number of bars and any invalidation.
- Measure false signals and continuation rates on unseen samples.
RELATED READING
Continue with guides selected for overlapping concepts and practical context.