ICT Bullish Order Block: Identification, Context and Testing
Learn how ICT traders mark a candidate bullish order block before an upward displacement, define invalidation, and measure retests without treating the label as evidence of institutional buying or a reliable edge.
Framework note: ICT terms are interpretations of price action, not proof of institutional motives or a market algorithm’s intent. No setup is guaranteed. Test clearly defined rules, account for costs and slippage, and use risk limits before risking capital. Read our editorial policy.
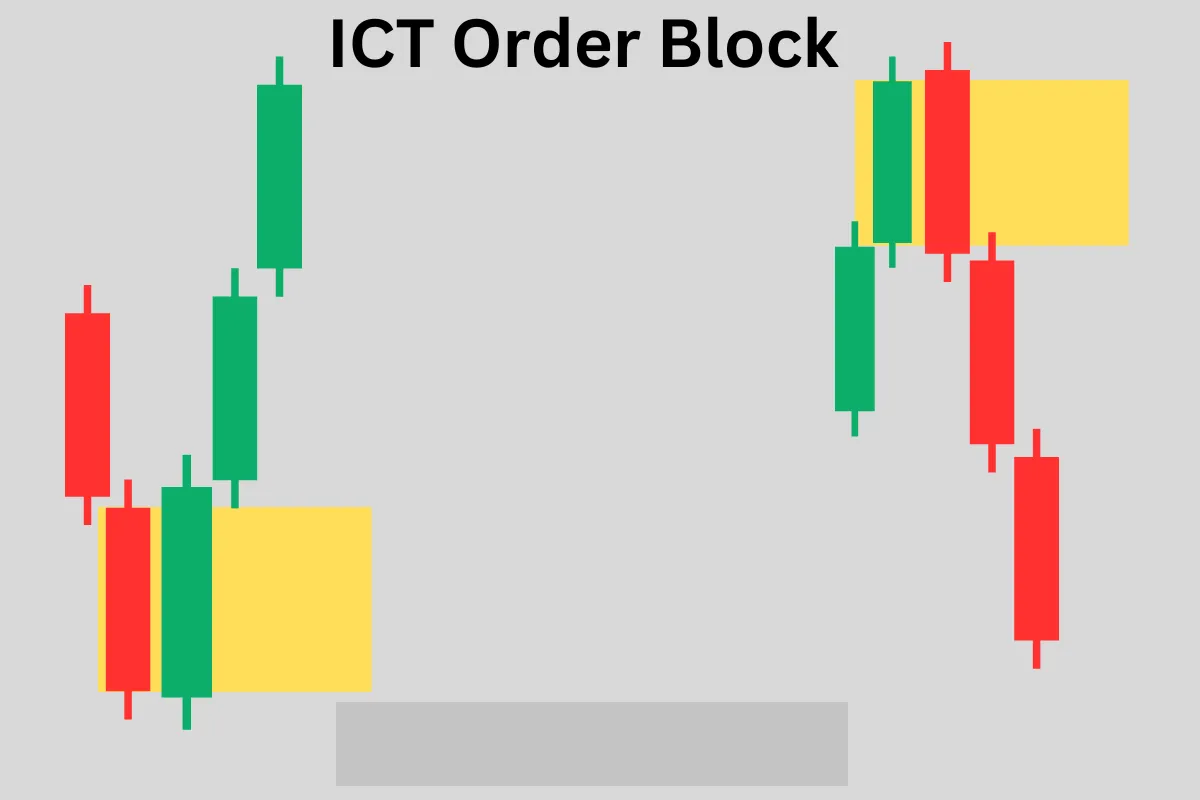
In ICT chart terminology, a bullish order block is commonly marked around the last bearish candle or candle sequence before an upward displacement. It is a candidate reference area, not proof of institutional buying; price may revisit it, pass through it or never return.
What Is a Bullish Order Block?
A bullish Order Block is the last bearish candle (close below open) — or last sequence of bearish candles — immediately before a bullish displacement move. The logic: before driving price higher, institutions needed to fill their buy orders. They did so during this last bearish candle, absorbing the selling pressure and accumulating their long position. When price returns to this zone, the same institutional buyers are waiting with additional orders — producing the bullish reaction.
Mark the bullish OB by the high and low of the last bearish candle before the bullish displacement. The low of this candle is the bottom of the OB zone; the high is the top. The CE is the 50% midpoint of the candle's body. This CE level is your primary entry point when price retraces into the OB.
The Three Qualities of a Strong Bullish OB
Quality One — Displacement strength: the bullish move that follows the OB must be a genuine institutional displacement: large-bodied bullish candles, minimal overlap, FVGs in the wake. The stronger the displacement, the more institutional conviction was behind the OB formation, and the more significant the OB zone is on the retracement.
Quality Two — Discount positioning: the OB must be in the discount zone of the current dealing range (below the 50% equilibrium). Buying a bullish OB in premium is a low-probability trade because you are buying expensive prices where institutional sellers are likely active.
Quality Three — Sell-side liquidity swept: the best bullish OBs form after a sweep of nearby sell-side liquidity (a swing low, equal lows, or previous session low). The SSL sweep collected the sell orders; the OB formation immediately after it represents the institutional accumulation that used that sweep liquidity to build the long position.
Entry Model for the Bullish OB
- Confirm daily or 4-hour bullish institutional order flow.
- Identify the bullish OB zone on the 1-hour or 15-minute chart (last bearish candle before the nearest bullish displacement).
- Confirm the OB is in discount (below the 50% of the current range).
- Wait for price to retrace into the OB zone during a London or New York Killzone.
- On the 5-minute chart, watch for the bullish confirmation: an upward displacement or a bullish FVG forming within the OB zone.
- Enter at the CE of the 5-minute FVG (preferred) or at the CE of the OB candle. Stop: below the low of the OB candle. Target: the nearest buy-side liquidity pool (equal highs, swing high, previous session high).
After entering a bullish OB trade, monitor the first 3-5 candles after your entry closely. If a genuine bullish OB is working, the first few candles after entry should be bullish-bodied with minimal retracement — characteristic of a Low Resistance Liquidity Run beginning. If the candles after entry are choppy and overlapping, the OB may not be holding as expected and the stop should be reconsidered. A valid bullish OB entry almost always shows immediate directional momentum.
Worked hypothetical example
Under a hypothetical bullish-block rule, a trader marks the last bearish candle before a defined upward displacement, then freezes that zone's boundaries. If price revisits it later, the trader checks the planned entry conditions rather than buying on touch alone. A close below the stated invalidation level means the setup failed by the written rule.
Failure case and what to test
The visual area cannot show that buyers accumulated there or that orders remain unfilled. In an ongoing downtrend, a block may fail and price can keep falling; a later bounce does not change what the rule said at entry.
Test checklist
- Define displacement and candle-selection criteria before marking the zone.
- Set invalidation and size the trade to planned risk.
- Record successful retests, failed breaks and zones that never return.
RELATED READING
Continue with guides selected for overlapping concepts and practical context.