ICT Balanced Price Range (BPR): Defining Overlapping FVGs
A guide to defining overlapping bullish and bearish FVG areas, choosing objective boundaries and testing retests without assuming the overlap represents unfilled institutional orders or a stronger edge.
Framework note: ICT terms are interpretations of price action, not proof of institutional motives or a market algorithm’s intent. No setup is guaranteed. Test clearly defined rules, account for costs and slippage, and use risk limits before risking capital. Read our editorial policy.
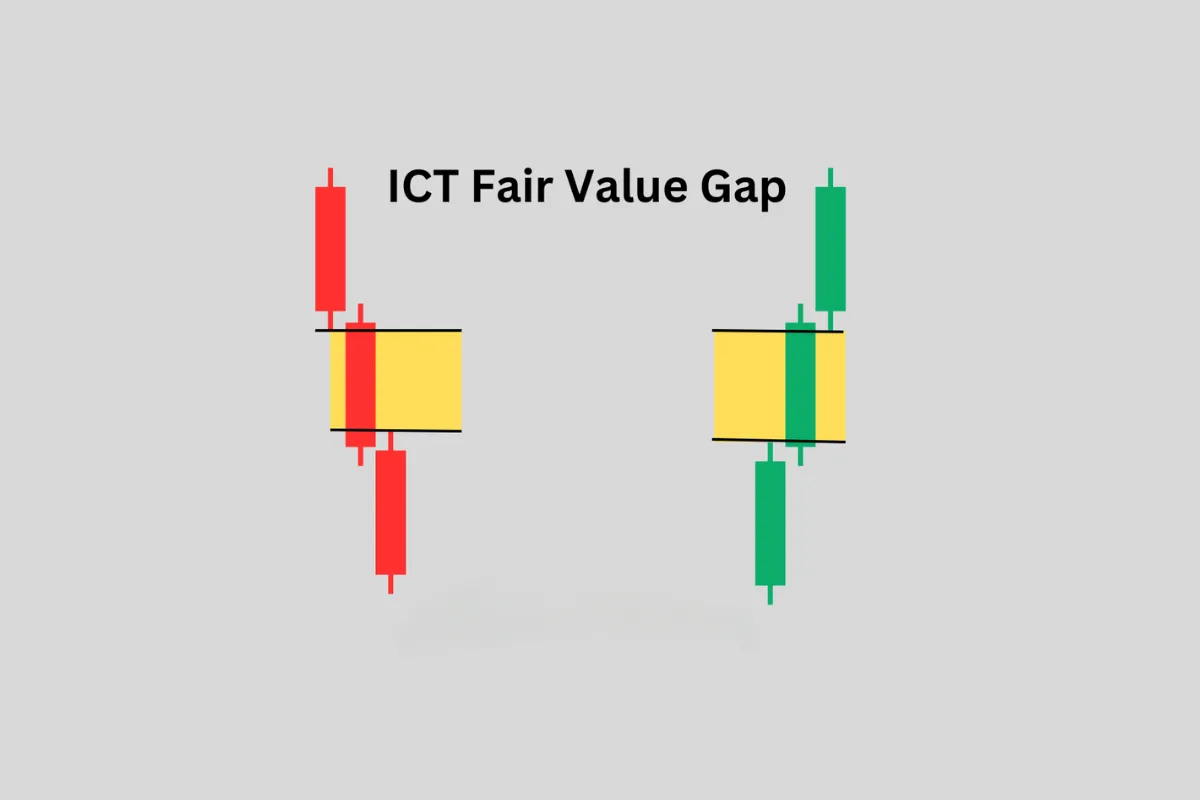
A Balanced Price Range (BPR) is an ICT concept commonly identified where bullish and bearish Fair Value Gap zones overlap. The overlap is visible, but claims about stacked institutional interest or the strength of a future reaction are interpretations. Test whether a BPR adds value beyond the individual gaps.
How a BPR Forms
The formation sequence of a BPR requires two displacement moves in opposite directions that leave overlapping FVGs. First, a bullish displacement creates a bullish FVG (a gap where sellers could not participate). Then, a subsequent bearish displacement creates a bearish FVG (a gap where buyers could not participate) — and the bearish FVG overlaps with or is completely within the range of the bullish FVG.
The overlap can be marked as a Balanced Price Range (BPR) under the selected FVG definition. It does not show that institutional orders from both sides remain unfilled or that price must react when it returns.
Why the BPR Is the confluence-based Entry Zone
Order-block, FVG and BPR labels can describe different chart configurations within ICT terminology, but they do not reveal participant identities or the size of any remaining positions. Test whether the extra overlap condition adds information beyond the underlying FVGs.
The overlap does not establish that an algorithm will have difficulty crossing the zone or that a reaction is more reliable. A trader can measure retest outcomes under a fixed rule, with invalidations and transaction costs included.
Identifying BPRs on Your Chart
- Mark all significant FVGs on your chart — both bullish and bearish.
- Look for any bullish FVG that has a bearish FVG overlapping it (or vice versa) on the same timeframe.
- The overlap zone (the price range that is within BOTH the bullish and bearish FVG) is the BPR.
- Mark the BPR zone. The CE of the BPR is the midpoint of the overlap zone.
- For entry: when price enters the BPR zone during a Killzone, watch for the reaction direction. In a bullish bias, you expect price to react bullishly from the BPR. The LTF reaction confirmation (MSS or displacement) tells you the reaction has begun.
BPR Entry Model
The BPR entry follows the same structure as other ICT entries but with tighter risk parameters. Entry: at the CE of the BPR (midpoint of the overlap zone). Stop: just beyond the outer edge of the BPR. Target: the next external liquidity pool. The combination of tight stop (the BPR outer edge) and a clear target (the DOL) typically produces R:R ratios of 5:1 or better from a BPR entry.
When building your pre-session analysis, specifically scan for BPRs in the path to your daily DOL. A BPR that sits between current price and a possible daily target is a reference area to monitor; price may pass through it or ignore it. If the BPR aligns with your HTF bias, it is your priority entry. If it is against your bias, it is your stop management level — expect a reaction there even while in a profitable trade.
Worked hypothetical example
A trader identifies a bullish imbalance between 100 and 102 and a later bearish imbalance that overlaps from 101 to 103. Under the chosen definition, the common area from 101 to 102 is marked as a candidate BPR. Price later crosses the full zone without pausing, which is recorded just like any other outcome.
Failure case and what to test
Small changes to swing selection, candle boundaries or gap definitions can change whether an overlap exists. Even a correctly marked overlap may offer no usable entry after spread, slippage and confirmation rules.
Test checklist
- Write down how each FVG boundary is measured.
- Mark the overlap before future candles form.
- Track reaction, clean passage and ambiguous cases separately.
RELATED READING
Continue with guides selected for overlapping concepts and practical context.