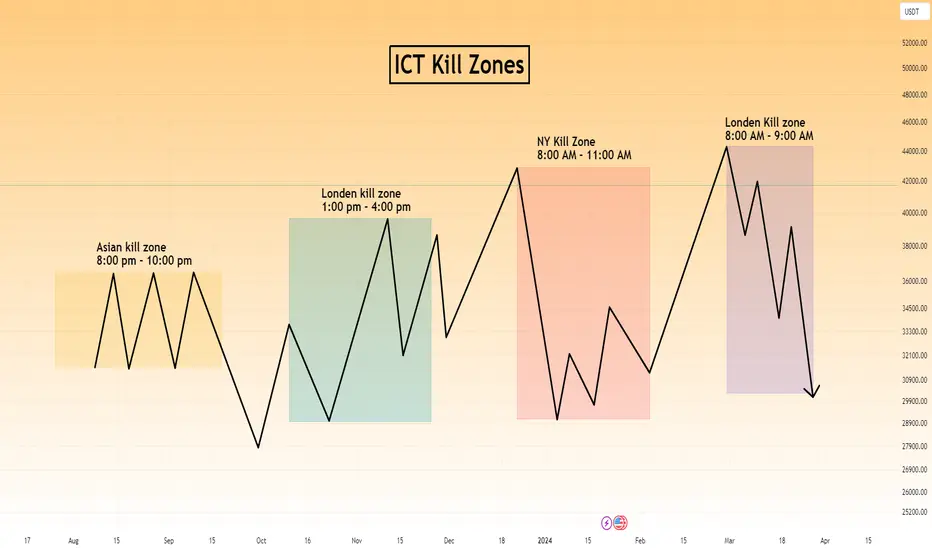
ICT Asian Range Trading Strategy — How to Use the Overnight Range
The Asian-session high and low can be used as reference levels for later observation, but neither a breakout nor a return into the range guarantees a London or New York setup.
Framework note: ICT terms are interpretations of price action, not proof of institutional motives or a market algorithm’s intent. No setup is guaranteed. Test clearly defined rules, account for costs and slippage, and use risk limits before risking capital. Read our editorial policy.
The ICT Asian Range Trading Strategy is one of the commonly studied and repeatable setups in the entire ICT framework. It is built on a simple but powerful observation: the Asian session creates a tight consolidation range every night, and the London and New York sessions systematically sweep one side of that range before delivering in the opposite direction. Once you understand this relationship, you have a high-probability directional bias for the start of every London and New York session.
Why the Asian Range Is So Important
The Asian session (roughly midnight to 6:00 AM New York time, or 7:00 AM to 1:00 PM Tokyo time) is a low-volatility accumulation period. Major institutional orders for the European and New York sessions are being quietly built during this window. The tight range that forms reflects the balance between institutional accumulation and the low participation of the Asian market participants.
The high and low of this range represent two things simultaneously: a balanced price range (institutions have been buying and selling within this zone to accumulate their full position) and liquidity pools (retail traders who placed stop orders above the Asian high and below the Asian low). When London opens and institutional execution begins, the algorithm almost always moves to collect one side of the Asian range first before delivering in the true direction.
How to Mark and Use the Asian Range
- Each day, mark the Asian session high and low on your chart. Identify the range between midnight and 6:00 AM New York time (adjust for daylight saving time).
- Note whether the Asian range is narrow (tight) or wide. A narrow Asian range has more accumulated institutional orders and typically precedes a larger London or New York move.
- Before London opens, determine your daily bias from higher timeframe analysis (HTF). If bullish, expect the London session to first sweep the Asian low (SSL sweep) before delivering higher.
- If bearish, expect London to first sweep the Asian high (BSL sweep) before delivering lower.
- The entry: after the sweep of the Asian range extreme, watch for the reversal displacement on the 5-minute or 15-minute chart. Enter at the first FVG created by the reversal displacement.
- Target: the opposite side of the Asian range first, then the next higher timeframe liquidity pool beyond it.
The Asian Range as a Stop Hunt Template
Some traders may place stops around visible highs and lows, but a chart does not reveal the exact orders present. A range sweep can reverse or continue; do not assume every break is a stop hunt.
This predictability is what makes the Asian range strategy work. When the sweep occurs, it triggers all those stops (providing the liquidity the algorithm needs), and then reverses immediately because the algorithm has accomplished its objective. The more obvious the Asian range boundaries are on the chart, the more liquidity has accumulated there, and the more violent the post-sweep reversal typically is.
Best Pairs for Asian Range Trading
The Asian range strategy works best on pairs and instruments that form clean consolidation ranges during the Asian session: EURUSD, GBPUSD, USDJPY, AUDUSD, and Gold (XAUUSD). These instruments all have clearly defined Asian ranges most nights. NAS100 and SPX create their own version of the Asian range during the overnight futures session, making the same strategy applicable to index futures trading.
Before each London session opens, your preparation checklist should include: mark the Asian range high and low, note the daily bias, determine which side will likely be swept first, and identify the first FVG zone you will trade if the expected sweep occurs. Having this plan in place before London opens means you can execute confidently rather than reacting emotionally to the initial volatility.
Worked hypothetical example
A trader defines the Asian range using a consistent timezone and records its high and low before London opens. Price trades briefly above the range high and then closes back inside. The trader logs a possible failed breakout and waits for the separate entry conditions in the plan rather than entering just because the boundary was crossed.
Failure case and what to test
Range boundaries change with the chosen hours, daylight-saving handling and data feed. Some breakouts continue, some reverse and some produce no practical trade after costs; selecting only reversals exaggerates the pattern.
Test checklist
- Fix the session boundaries and timezone before collecting data.
- Record breaks, returns, continuations and days with no signal.
- Measure outcomes separately for narrow and wide ranges if that is part of the hypothesis.
RELATED READING
Continue with guides selected for overlapping concepts and practical context.